ES Setup and Recap from 10/20/2010
Mark had a terrific call today in the ES from our Futures Calls Service, which has been on a nice roll this week, winning 5 out of 7 triggers.
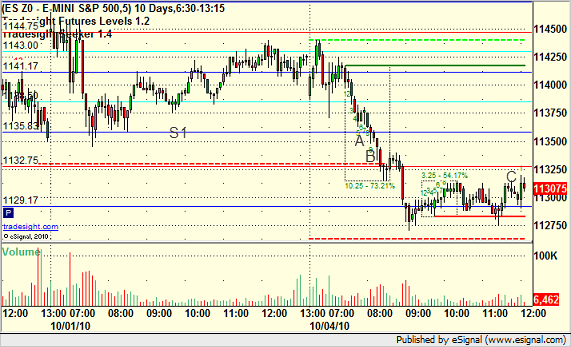
The early market action today played with several of our key Levels, and Mark waited for the opening half hour range to complete and establish. He then noted that the low of the session was essentially the Pivot and the high was a point that left plenty of room to the R1. Our first target is always 6 ticks. The black lines on this chart denote the high and low of the opening range that he used for long and short entry calls:
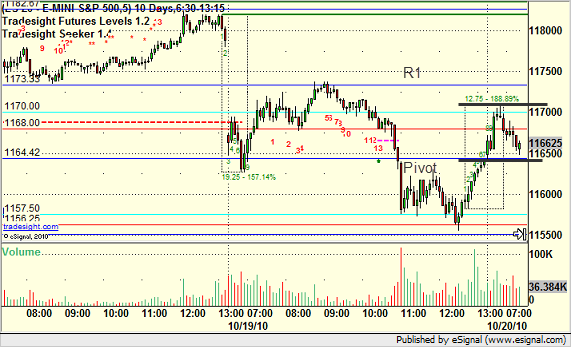
Note that one of the keys is that you have enough room after either entry before another expected support and resistance point. We'll focus here on the long side, as that is the trade that triggered.
The market headed up and the ES exactly addressed this level again, which is what we call "setting" the level:
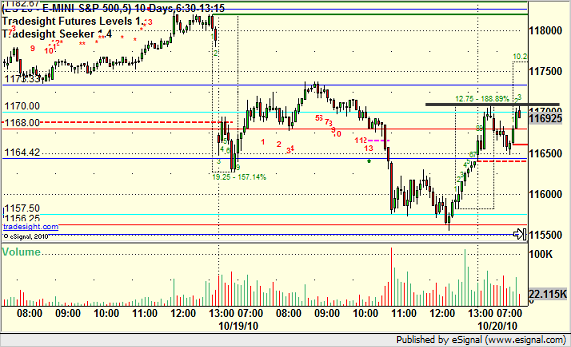
That improves the call. We're risking 6 ticks plus a 1 tick spread here on the entry, and we have more than 6 ticks until the R1 level if it triggers, which it does. It quickly runs to R1, taking us out of half of the trade and making for a no-lose scenario as we move the stop under the entry:
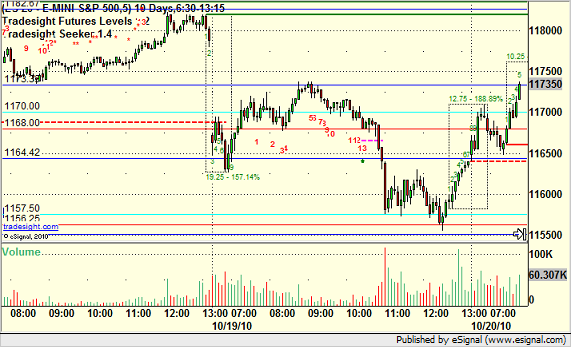
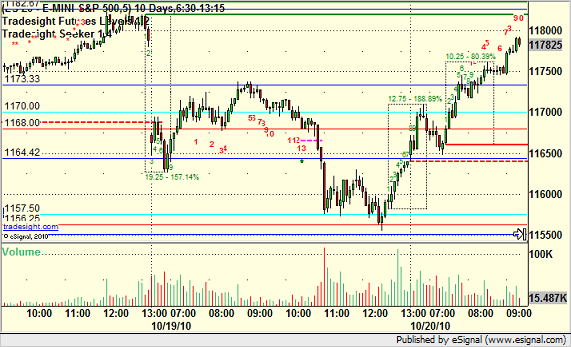
From there, you continue to raise stops until you get stopped out of the trade as it plays out during the day:
As the market enters the better half of the year from a trading perspective (October through April) and as we prepare to launch the new Tradesight 4.0 website, expect a lot more recaps like this.
Tradesight Market Preview for 10/20/2010
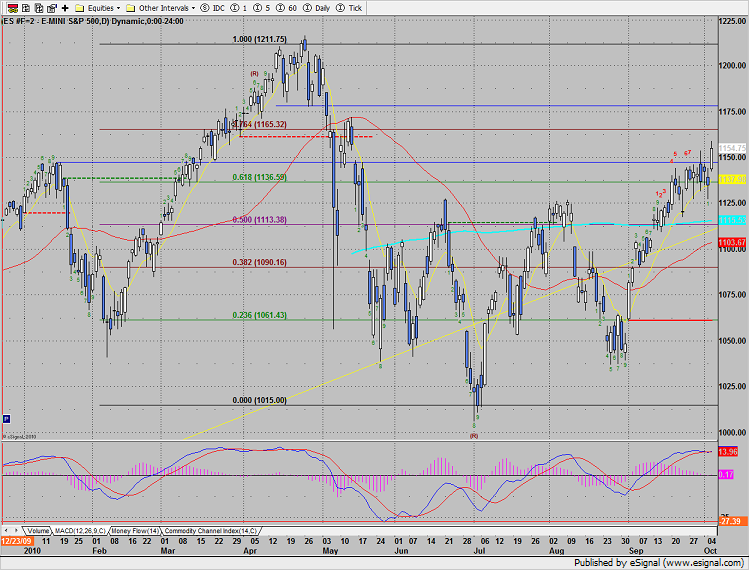
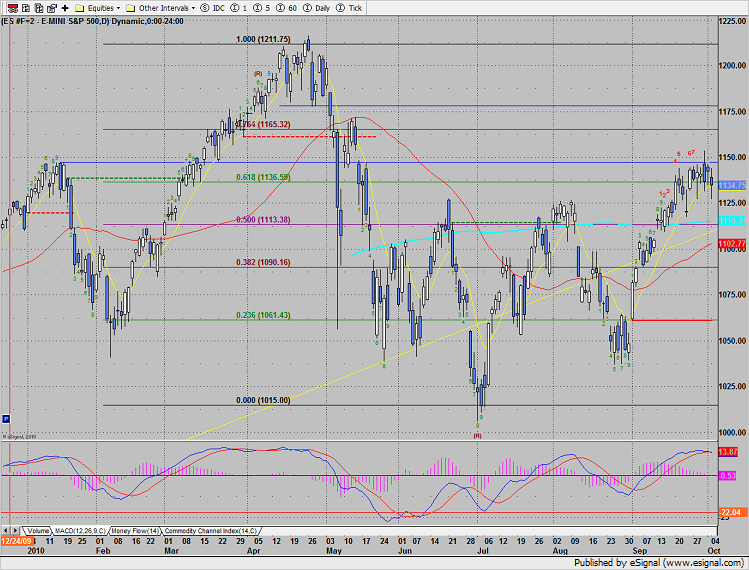
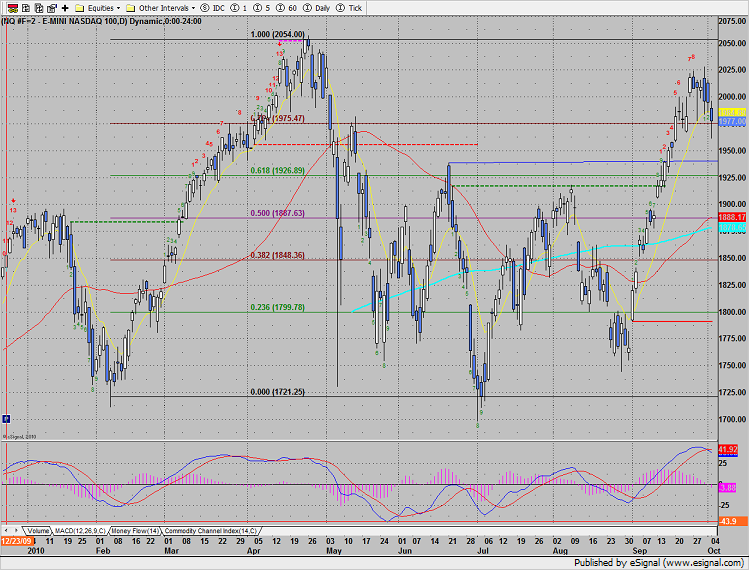
BANG! The correction begins. The SP broke hard, losing 14 on the day. In so doing, the 13 exhaustion signal has qualified. Price settled under the 10ema and also recorded a price flip. The price flip is noted on the chart because today’s close was below the close 4 days ago.

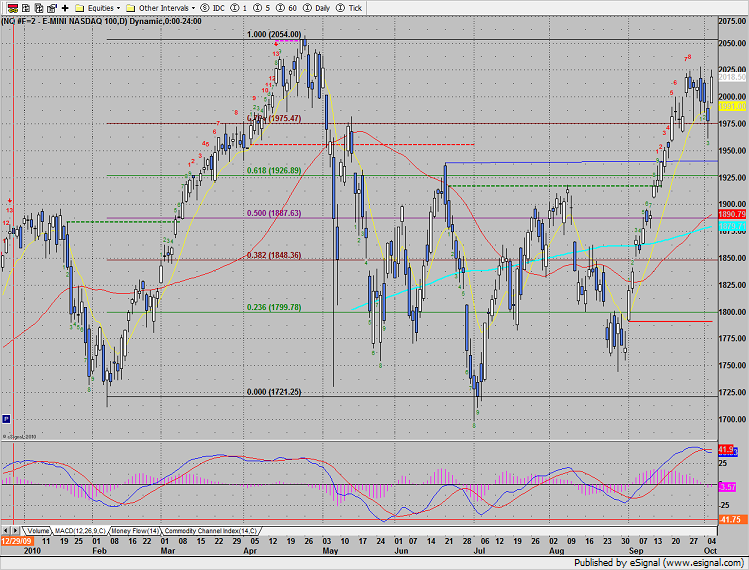
Naz lost 27 but did not record a price flip or settle under the 10ema. Note on the chart that the low of the day was right at the April high. This will be a very key short term area. A settlement under this area puts 2k in play.

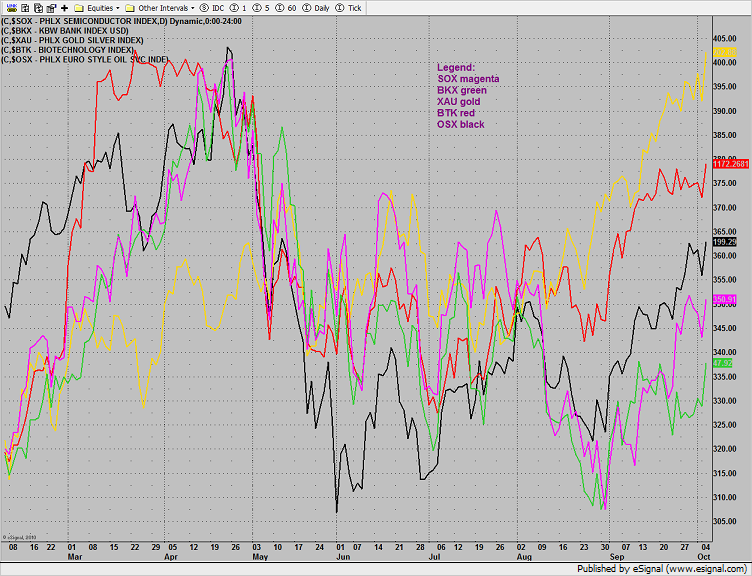
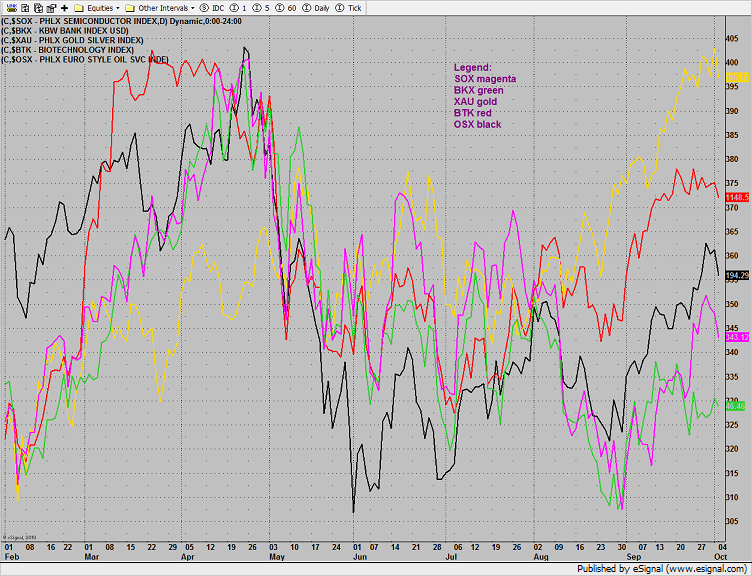
Multi sector daily chart:

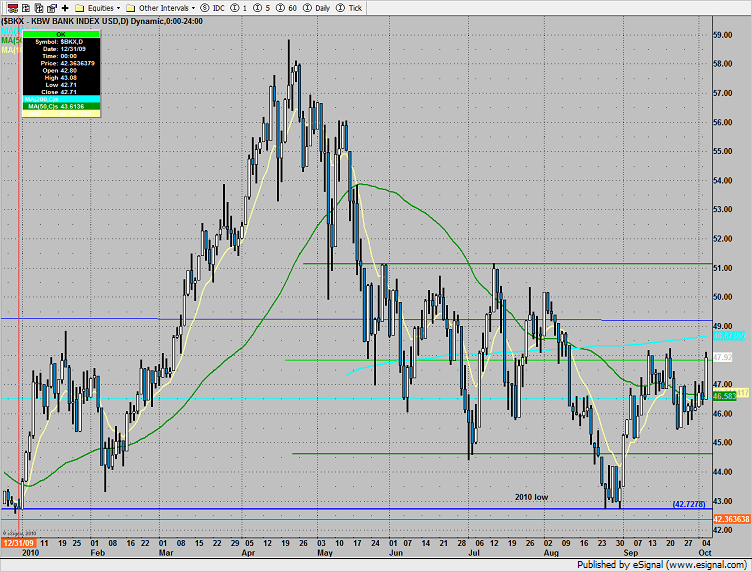
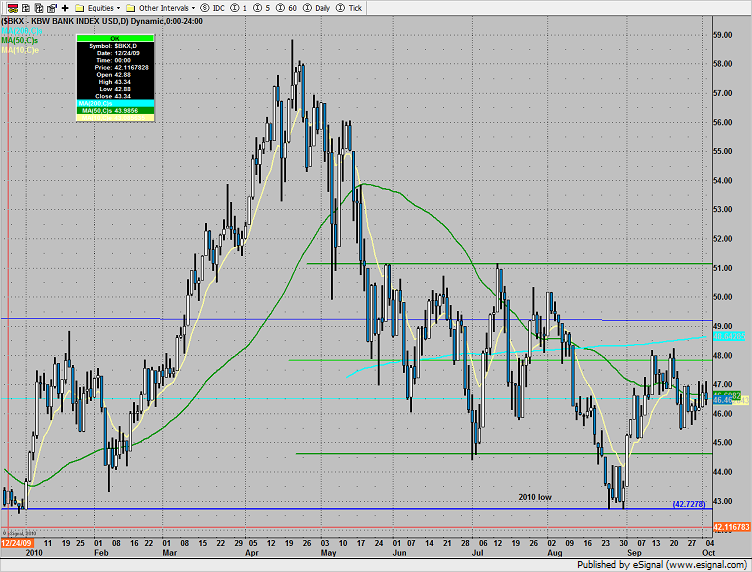
The BKX was one of the strongest sectors on the day. This is of only small comfort because how badly the index has lagged the broad market over the last couple of weeks.

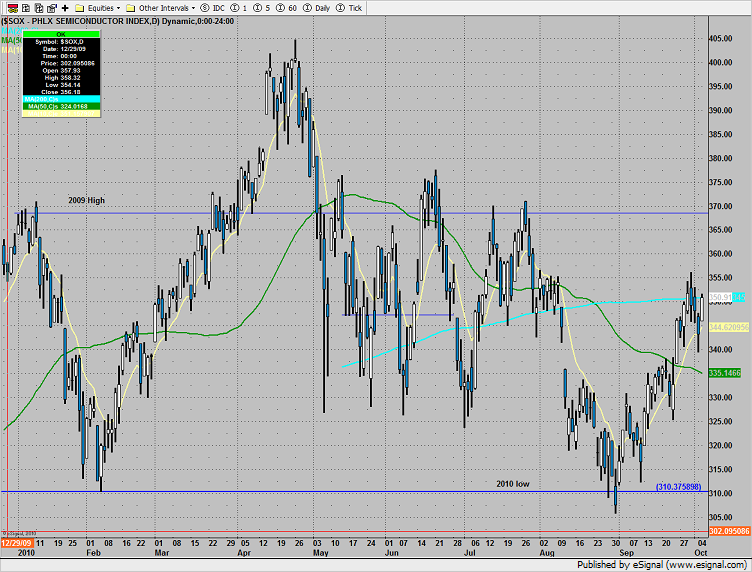
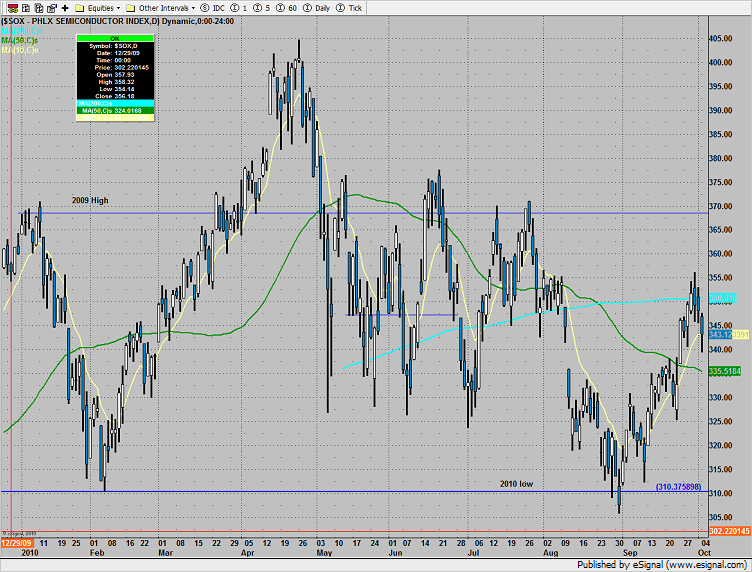
The SOX closed under the 200dma and on the south side of the recent trading range. If price breaks under the DTL (blue) the 2010 low will be in play.

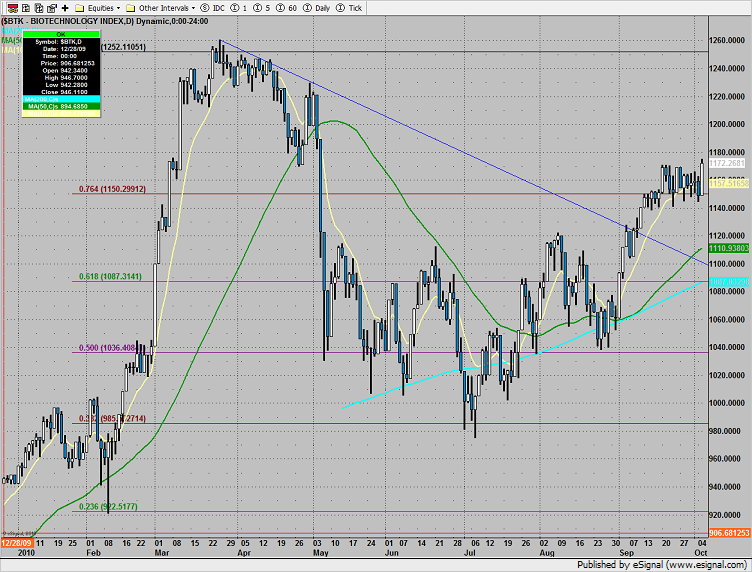
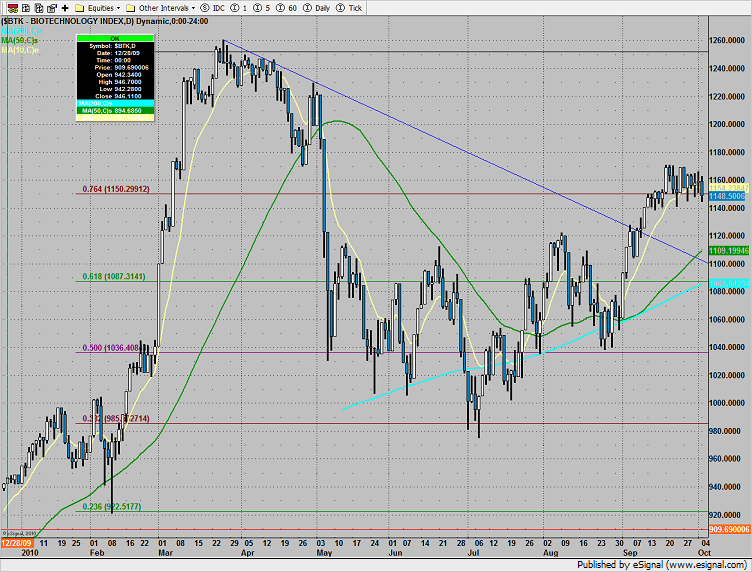
The BTK collapsed right back into the trading range. This means the recent breakout is still not qualified.

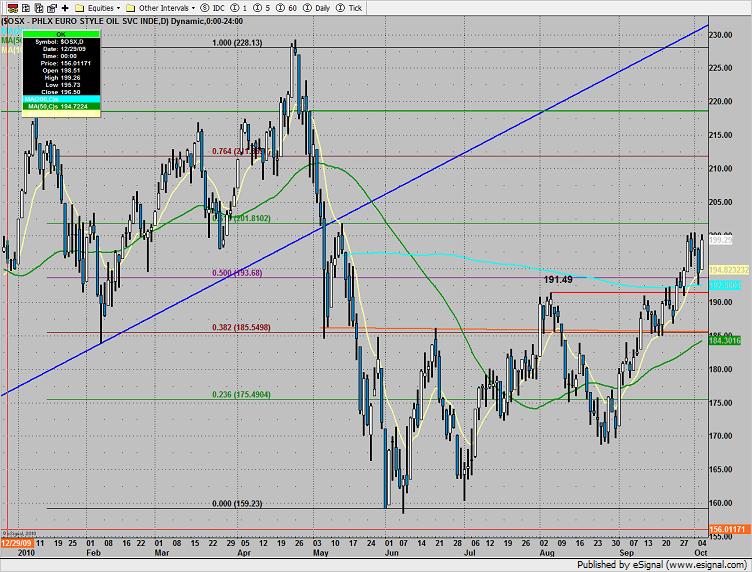
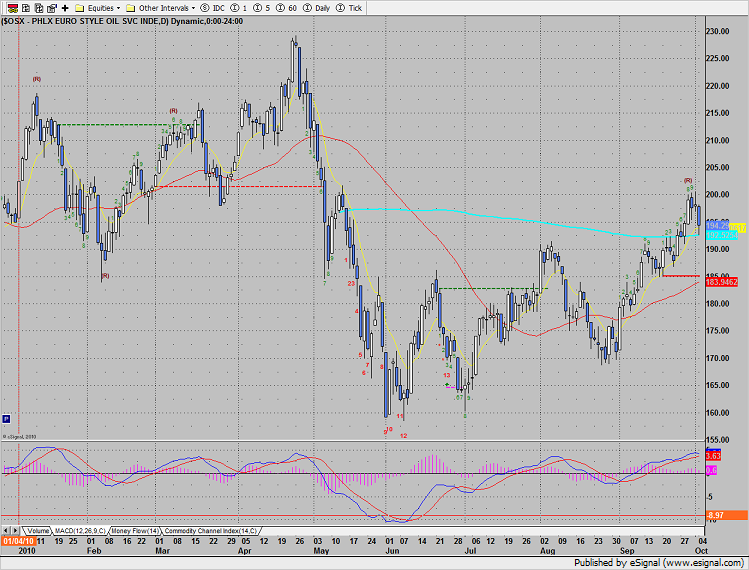
The OSX, in the crosshairs of rising interest rates in China, got hit very hard. The 200 level is near term support.

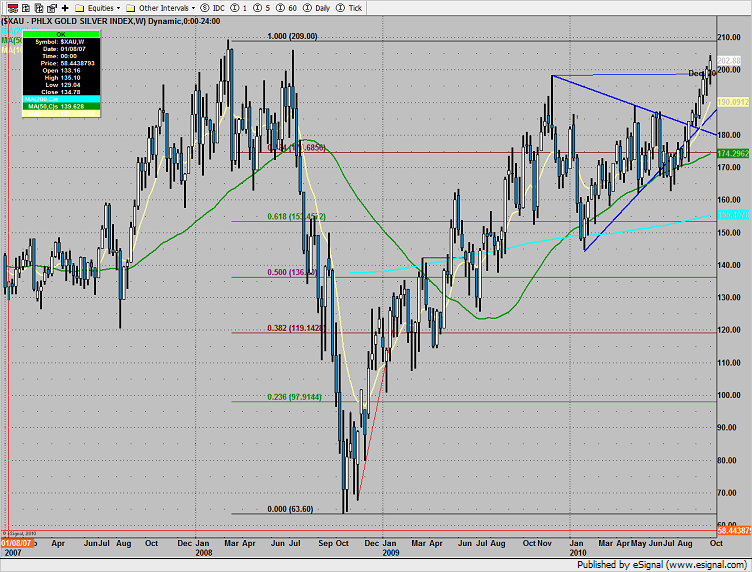
The XAU finally got what it had coming. A full fledged profit protecting whipping. This is a meaningful break. The May high and 50dma around 190 will be a key area and potential first trade-to-target.

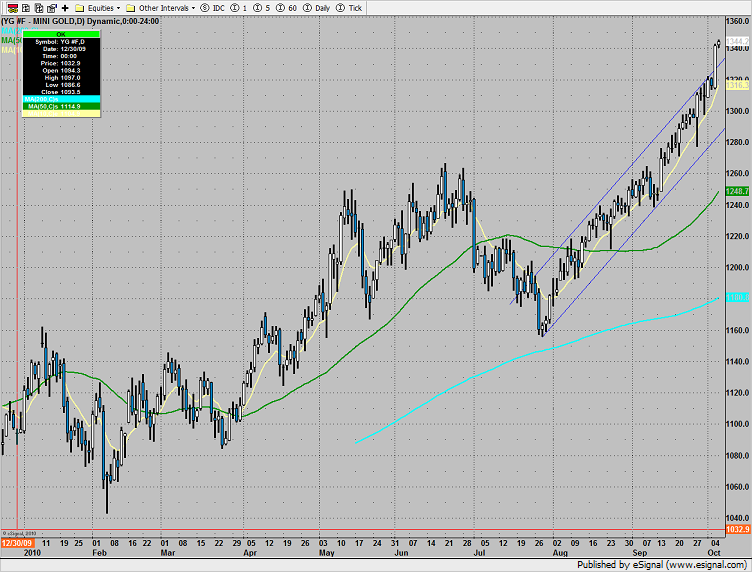
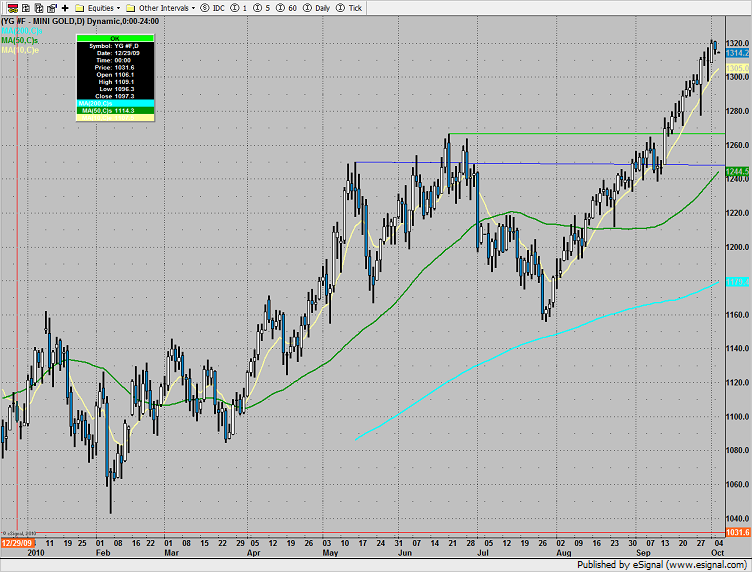
Gold got crushed, down $35 on the day. If price crosses and loses the lower channel line, then the June high breakout is in play.

Tradesight Stock Calls Summary from 10/19/2010
We're adding a new feature to this section of the report daily. With each stock's recap, we will include a (with market support) or (without market support) tag, designating whether the trade triggered with or without market directional support at the time. Anything in the first five minutes will be considered WITHOUT market support because market direction cannot be determined that early.
KLAC (with market support) triggered long, didn't quite go enough for a partial:

AMGN (with market support) triggered long and did:

FFIV (with market support) short worked great:

In the Messenger, Rich's early SNDK (without market support) call worked for over $0.50:

His IBM (without market support) didn't work:

My AMZN (with market support) long call worked nice:

Rich's BRCM (with market support briefly) swept:

His RGLD (with market support) worked:

His NEM (with market support) didn't work:

Our AAPL call worked long (with market support) and then my AAPL short (with market support) worked after lunch:

So out of the nine trades that triggered with market support, 5 worked big, 2 worked enough for a partial to become no loss, and 3 were small losses.
Tradesight Forex Calls Summary for October 19, 2010
Nice night. See AUDUSD, EURJPY, and GBPUSD below for winners. Only thing that didn't work was the NZDUSD Value Area. Still short GBPUSD with at least a 125 pip winner working.
New calls tonight and Chat. Great week so far AND ranges have been average or better two days in a row. If this continues, we'll be moving back to normal size next week finally.
 24 Hour EUR/USD 24 Hour EUR/USD |
24 Hour USD/JPY |
| 24 Hour GBP/USD Triggered long early (half size) at A and stopped. Triggered short at B, hit first target at C, and lowered stop several times, currently short with stop a few pips over S2 which is being used as resistance at D:  |
24 Hour USD/CHF |
24 Hour USD/CAD |
| 24 Hour AUD/USD Value Area worked nicely from A to B:  |
| 24 Hour NZD/USD This is the Value Area that didn't work:  |
24 Hour GBP/JPY |
| 24 Hour EUR/JPY Value Area worked PERFECTLY, no risk, from A to B:  |
24 Hour GBP/CHF To receive these reports daily and the trade calls that led to over 200 pips in winners tonight, take the $2.99 trial of our service (two weeks) or sign up for the Forex package today. Prepare for the launch of the new Tradesight website this week! |
Market Outlook for October 19, 2010
The SP made a new high close on the move, adding 3 points to the intermediate rally. The 13 exhaustion remains active but has yet to qualify itself. To qualify the signal, price needs to either close below the 10ema or register a “price flip” by closing below the close 4 bars ago.


Naz was weaker than the broad market, losing a small fraction on the day. Price has settled above the risk level (magenta line) so if Monday’s high is exceeded by on tick the sell signal will have failed.
Multi sector daily chart:

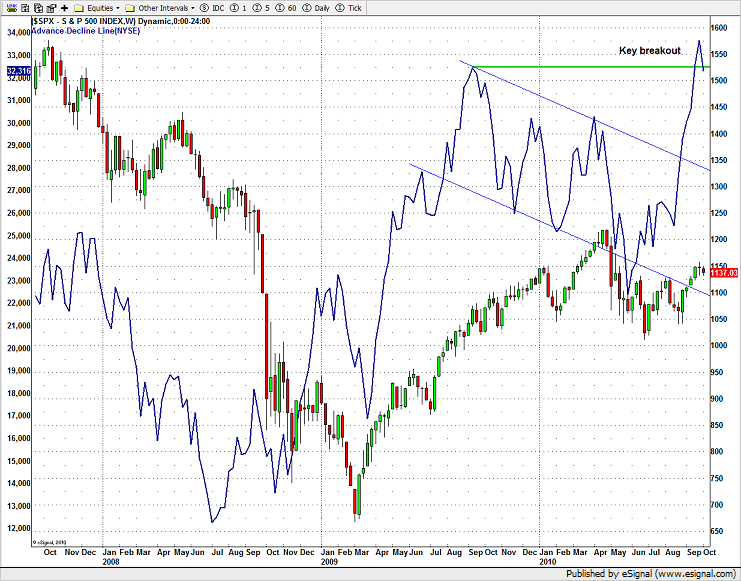
The weekly cumulative NYSE A/D line remains very positive. This indicator usually leads price by weeks or months.

The 10-day Trin remains much closer to the overbought area than the oversold threshold.

The BKX was the top performing sector closing up 3%. The chart is still technically negative until price exceeds the recent range (approximately the 200dma).

The BTK has finally broken out of the trading range. Since a great deal of time was spent in the consolidation, there could be multiple days’ worth of price advance.

The OSX did little and is currently having trouble with the 210 level.

The XAU has declined to the bottom of the recent trading channel. If price begins to rollover and follow through then the recent static trend line will be in play. Note that the MACD looks vulnerable.

The SOX was the weakest major sector. Price continues to badly lag the SPX and NDX. Price broke out above the DTL but has been very reluctant to get upside momentum.

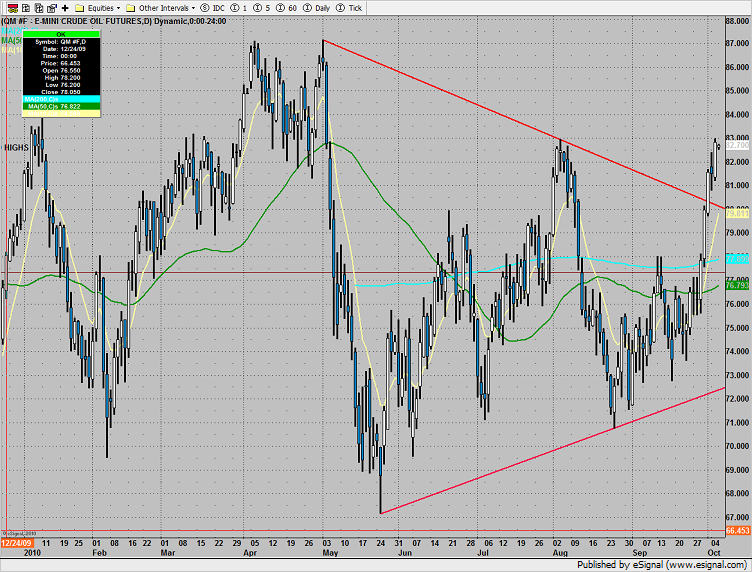
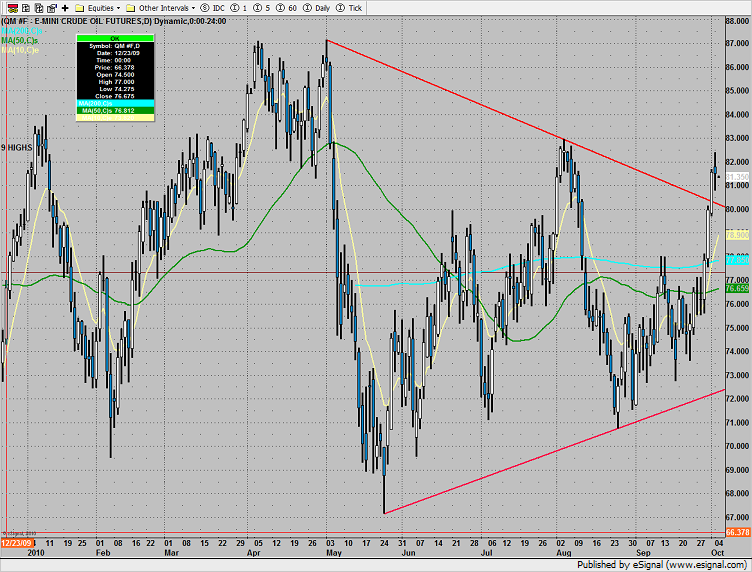
Oil had a strong day, especially considering the early strength in the US dollar.

Gold remains positive but very extended. A sharp correction could be very close at hand.

Tradesight Stock Triggers from October 18, 2010
No triggers off of the report, but a great session overall in the Messenger. Note that market direction matters...and it was UP all day (see below).
Rich's BIDU out of the gate worked great:

RIMM short (against market direction) didn't do much:

FSLR long worked great:

Rich's FFIV short was a huge winner and the one short that worked despite the market (which is why we try them all and keep tight stops):

GS long worked great:

EBAY short (against market direction) didn't work:

Rich's FAS worked:

Rich's CRM short (against market direction) didn't work:

Tradesight Market Preview for October 6, 2010
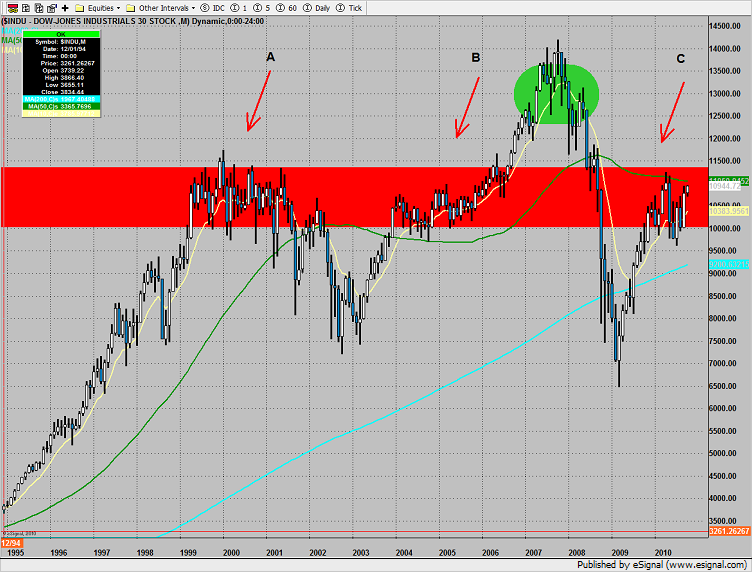
For some perspective, let’s examine the very long term monthly chart of the Dow Industrials. The first thing that should jump out is the very well defined band of trading between 10,000 and 11,500. This is represented by the red band on the chart. On the left side of the chart, at point A, there was an extended period of accumulation that ultimately failed when the tech bubble burst. The ensuing collapse ran its course and price reentered the trading band at point B. In 2006 the Dow was finally able to breakout over the trading range to make new all time highs. The index churned, ultimately failed and then truly collapsed in 2008. Currently, price is back in the primary trading range with an upward bias. While the financial commentators may be bubbling with enthusiasm, market sentiment remains very negative. Alternative asset classes like bonds and gold are all at or near range high which means that the FOMC fire hose of liquidity is lifting all boats. If one is onboard with this thinking, is the Dow in a bull market or a bounce? It is unlikely that the Dow is in a new bull market until the trading band has been exceeded and confirmed by asset reallocation swapping from bonds and gold into equities. At present, the Dow Industrials have been in the trading range (red band) for about one year. The two previous penetrations at point A and point B lasted for 2 ½ years before leaving the range. And for those keeping score at home, the time spent above the trading band (green bubble) between 2006 and 2008 also lasted for approximately 2 ½ years.
The SP broke above the recent trading range and added 20 on the day to settle at a new high. The next area of interest is the 1165 fib.
Naz was up 41 on the day but neither recorded a new high nor a new high close. The MACD has turned negative.
Gold stocks continue to outperform on the multi sector comparison chart:
The BKX was as top sector, performing equally with the XAU. The key sector was up 3% but did not break the recent range or record a new high close.
The XAU made a new high on the move but not a new all time high. Below is the long term weekly chart showing the fibs and prior high water mark.
The OSX was just short of a new high. Set an alarm for a break over 200.50.
The SOX, performing in-line with the NDX settled right at the 200dma.
The BTK could provide some setups. Price settled right at the prior range high. Monitor this sector for breakout trades.
Oil continued its pattern breakout, making a new high close on the move.
Following the quantitative easing from the central bank of Japan, gold exploded to a new all time high. The angle of assent has left the well organized channel and is beginning to get steep.
Tradesight Market Preview for Tuesday, October 5, 2010
The SP lost 7 on the day and did a few interesting things technically. First the early gap down was filled before price went south. The settlement, call it 1135 is a level that has recently been in play. What didn’t happen today was that 1125 was not tested. Many seasoned traders don’t consider a level truly tested until it is penetrated and then the reaction to the breech can be observed. The action of the MACD need to be monitored closely over the next few sessions.
Naz traded at a 7 day low. Losing 17 on the day is not a positive development but price didn’t settle below both 7 and 11 days ago which would be very bearish. The MACD has crossed over. 1940 will be an important level if price continues lower.
Multi sector daily chart:
Friday the weekly cumulative A/D line settled at a new high on the move. This is a very bullish development for the long term trend. Since the cumulative A/D line usually leads price, the chart implies that the next intermediate-term pullback in the broad market should be bought
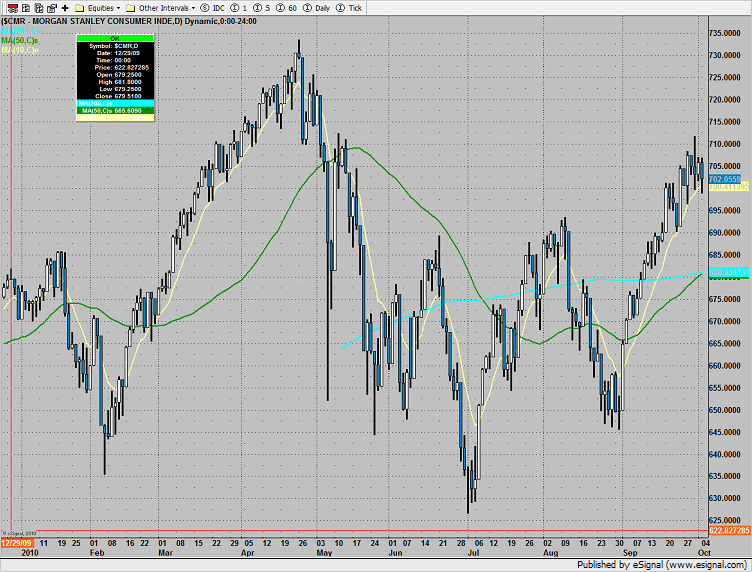
The defensive consumer index was the top gun:
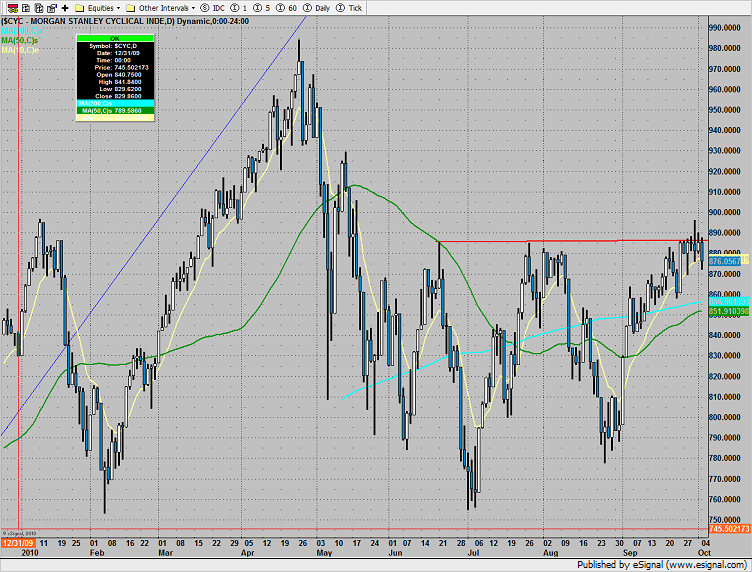
The economically sensitive cyclical index underperformed the broad market, never closing over the June highs.
The BKX remains boxed up with an overall downward bias.
Set an alarm for a break under 1140 in the BTK which would mark a loss of the recent support zone.
The SOX acutely underperformed both the broad market and the Naz. If we’ve seen the extent of the rally off the August lows, then the market has a bad smell.
The OSX was pathetic all day. Price could easily penetrate the 200dma but 190 better hold. If not the full weight of the recently completed 9 bar run may be felt.
Gold was slightly lower on the day:
Oil held up surprisingly well:
Tradesight ES Winner Under S1
This morning, we monitored the early action in the index futures without making a call as no clear pattern or setup emerged in the first 30 minutes that we could commit to. However, taking a step back and looking from a wider perspective, we called the short under the S1 level with a 7-tick stop. Notice how today's blue S1 line was used on Friday by the market:
The trade triggered short at A, we took half off for six ticks to build a cushion at B, and continued to lower our stop throughout the day until the trade closed at C for a 16-tick winner on the second half of the play.
Sometimes, patience is the best plan.
Tradesight September 2010 FOREX Results
One of the things that I have resisted in the past is "track record" type of stuff, especially in the FOREX market where so much is dependent on which hours you have available to focus on the market. It's not real fair, in my opinion, for you to try to match my trades if I'm staying up until 3 am your time and you have to go to bed at 11 pm. That's why we prefer to teach people how to trade rather than just to have them follow the trades.
However, at some level, there has to be evidence that the calls that we make each day in the Messenger using the Levels create a working system, even if the idea is that you should tweak that system to work on your own time.
So, I spent a lot of time thinking about what would be a fair way to track the results. When you do tracking, it is important to lay out the exact methodology of how you are tracking the results so that someone can look back going through the reports and come to the same number. At first, I was considering factoring in everything about trade size and time of day, but again, that starts to factor in items that mean that some people might not be able to follow directly.
And then I came to a very basic statistical conclusion. In the end, what we just want to do here is count pips with the LEAST complex set of parameters. Conversations about trade size, etc., is all important and should be overlaid into these results. But without making everything a matter of "well I was full size on this one but you should have been half size," we can start by just saying "What would have happened if you would have taken all of these calls, sold half at the first target, kept the stop where it should be, and adjusted based on what is in the Messenger?"
And once I stopped trying to make it complicated, well, it got uncomplicated.
Here are the rules.
1) Calls made in the calendar month count. In other words, a call made on August 31 that triggered the morning of September 1 is not part of September. Calls made on Thursday, September 30 that triggered between then and the morning of October 1 ARE part of September.
2) Trades that triggered before 8 pm EST / 5 pm PST (i.e. pre Asia) and NEVER gave you a chance to re-enter are NOT counted. Everything else is counted equally.
3) All trades are broken into two pieces, with the assumption that one half is sold at the first target and one half is sold at the final exit. These are then averaged. So if we made 40 pips on one half and 60 on the second, that's a 50-pip winner. If we made 40 pips on one half, never adjusted our stop, and the second half stopped for the 25 pip loser, then that's a 7 pip winner (15 divided by 2 is 7.5, and I rounded down).
4) Pure losers (trades that just stop out) are considered 25 pip losers. In some cases, this can be a few more or a few less, but it should average right in there, so instead of making it complicated, I count them as 25 pips.
5) Trade re-entries are valid if a trade stops except between 3 am EST and 9 am EST (when I'm sleeping). So in other words, even if you are awake in those hours and you could have re-entered, I'm only counting things that I would have done. This is important because otherwise the implication is that you need to be awake 24/6.
You can go through the reports and compare the breakdown that I give as each trade is reviewed.
Each month, I will copy those instructions, then give a basic breakdown, and then discuss the specifics. We also will include a "worst losing streak" number. This month, we had a period late in the month losing 5 in a row. I always focus on that because people need to understand that when figuring out their trade size. 5 losers in a row = 125 pips that you are underwater out of the gate if those were the first trades you did.
Tradesight Pip Results for September 2010
Number of trades: 38
Number of losers: 16
Winning percentage: 57.8%
Worst losing streak: 5 in a row (September 27-28)
Net pips: +308
One other thing we want to consider in reviewing the calls each month is the overall environment, and we have a very easy way to consider this, which is to look at the ADR (Average Daily Range) changes during the month. Remember that the ADR takes the daily range (high minus low) and averages that over each day for the last six months or so. Whether the ADR moved up or down during the month tells us whether ranges were, on average, better than average or not.
For example, on August 1, the ADR on GBPUSD was 173 pips. By the end of August, the ADR on GBPUSD was 167. A 6 pip drop in the ADR over one month when you are averaging six months of data is pretty significant. That makes sense given that August ranges were the worst of the year, as expected.
So how did ranges fare in September? At the end of the month, average ranges were all within 3 pips of where they started the month. Meanwhile, the GBPUSD, for example, moved up 2. So basically, we can read into this that ranges were slightly better than they had been in August, but not noticeably so. This fits with the fact that I haven't yet adjusted my size back up because we never really saw even a week where the pairs traded above ADR 3 out of 5 days. In many ways, this activity still feels like summer volume activity, maybe just a little bit better.
One of the reasons that I decided to start tracking this is that I know once we have several months of these logged, there will become some obvious statistical relevance to the data. For example, I would anticipate that in a month where ranges improved, our win/loss ratio will push up closer to 65% (might even get higher sometimes) over September's 57% and our net gains should be higher.
Remember that trading systems aren't based on luck, they are based on doing as close to the same thing over and over that you can based on a system that works and letting it play out. A winning system nets you money not just because of what happens in one week or one month, but what happens over an extended period of time that covers good and bad environments for the market.
And now, on to October and the last quarter of 2010.