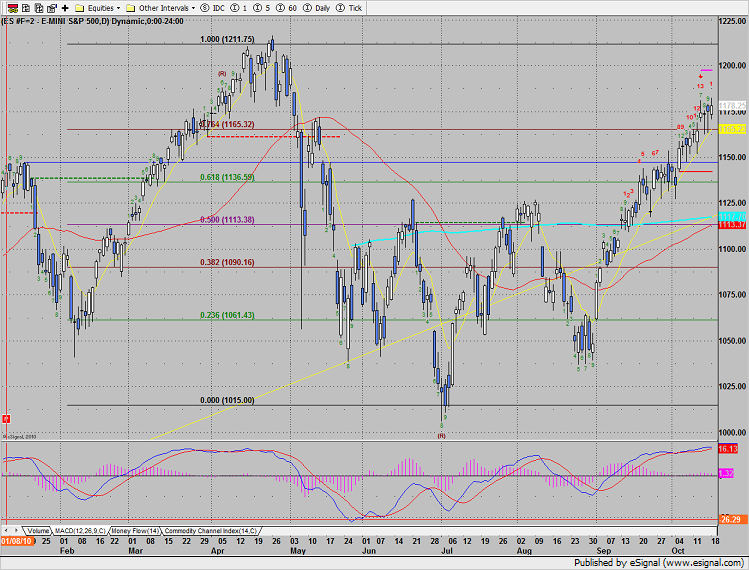
The SP made a new high close on the move, adding 3 points to the intermediate rally. The 13 exhaustion remains active but has yet to qualify itself. To qualify the signal, price needs to either close below the 10ema or register a “price flip” by closing below the close 4 bars ago.
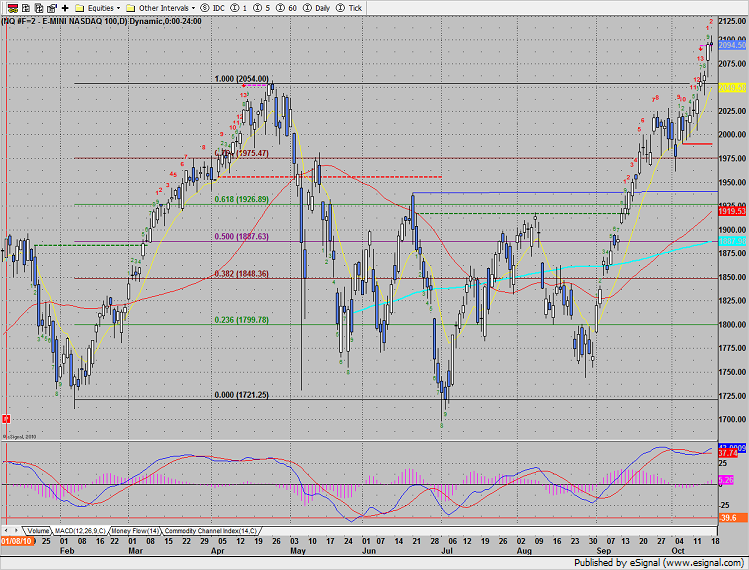
Naz was weaker than the broad market, losing a small fraction on the day. Price has settled above the risk level (magenta line) so if Monday’s high is exceeded by on tick the sell signal will have failed.
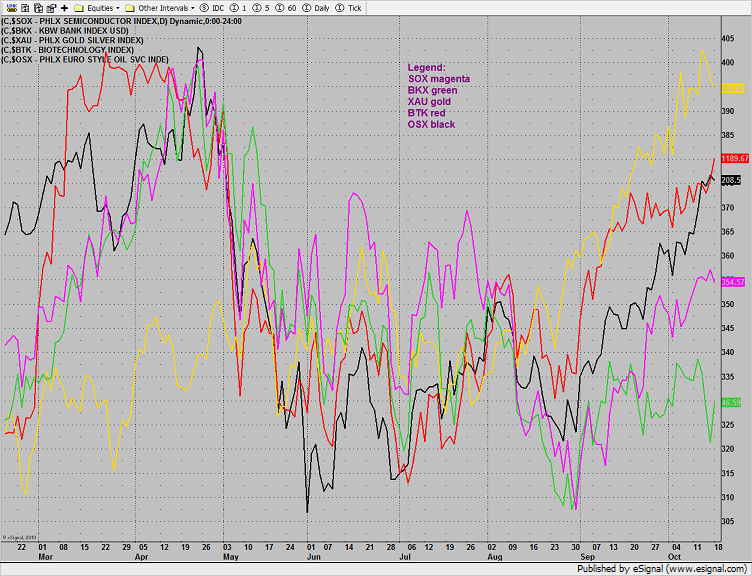
Multi sector daily chart:
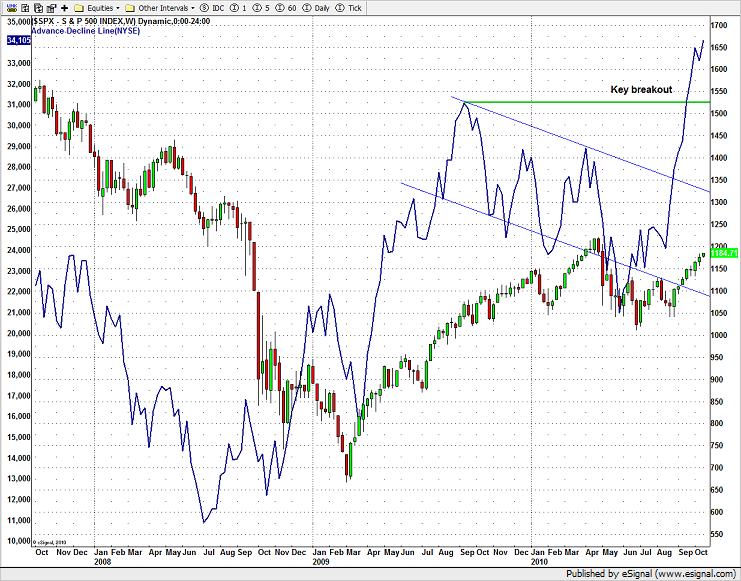
The weekly cumulative NYSE A/D line remains very positive. This indicator usually leads price by weeks or months.
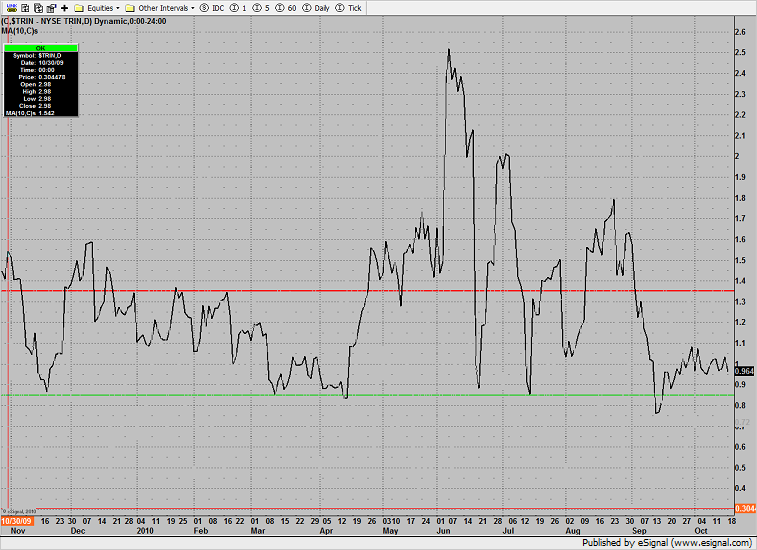
The 10-day Trin remains much closer to the overbought area than the oversold threshold.
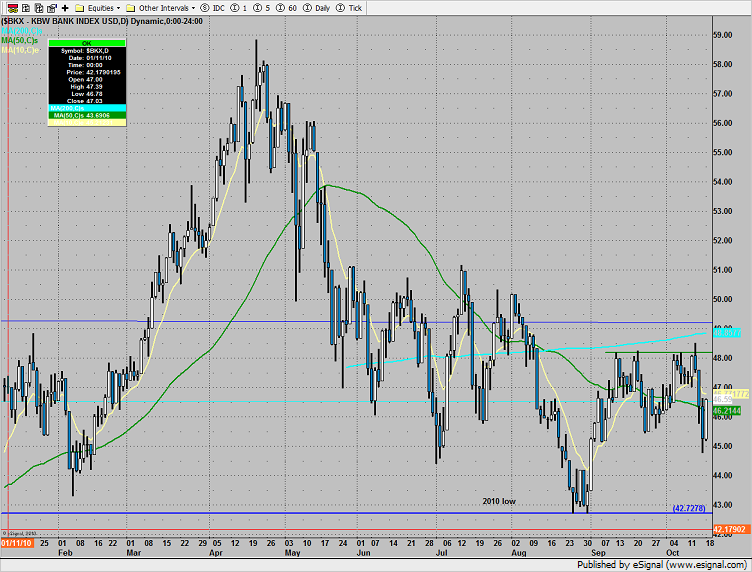
The BKX was the top performing sector closing up 3%. The chart is still technically negative until price exceeds the recent range (approximately the 200dma).
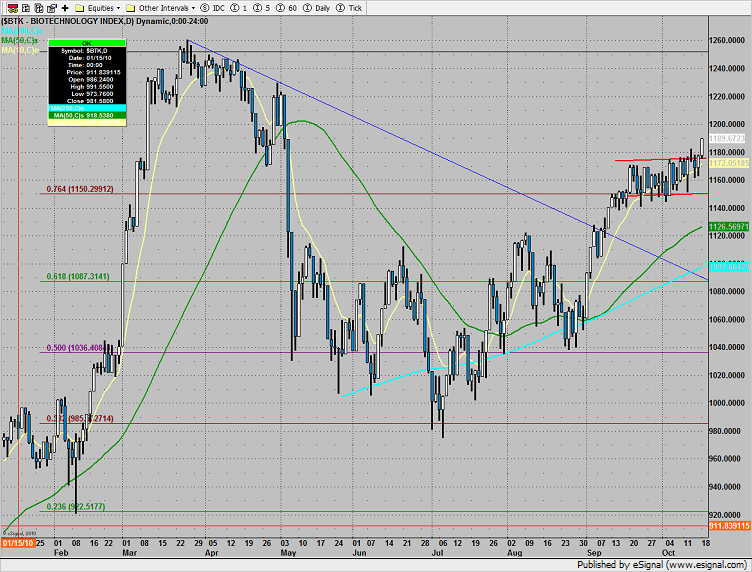
The BTK has finally broken out of the trading range. Since a great deal of time was spent in the consolidation, there could be multiple days’ worth of price advance.
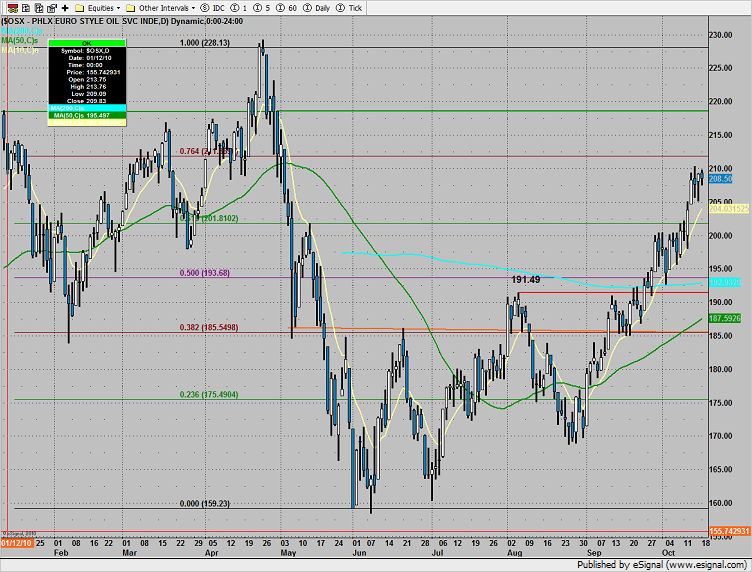
The OSX did little and is currently having trouble with the 210 level.
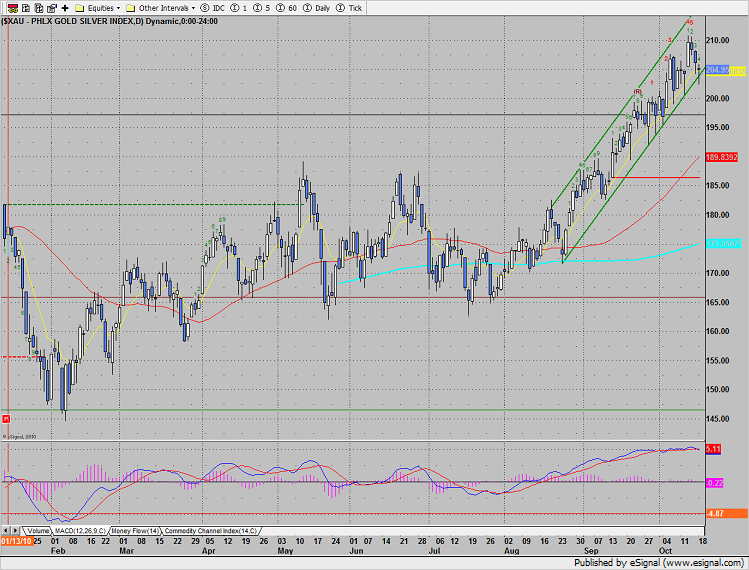
The XAU has declined to the bottom of the recent trading channel. If price begins to rollover and follow through then the recent static trend line will be in play. Note that the MACD looks vulnerable.
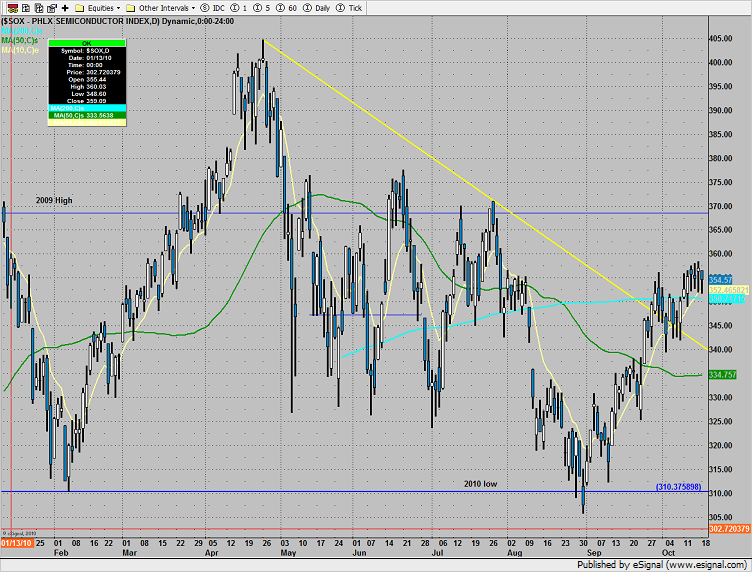
The SOX was the weakest major sector. Price continues to badly lag the SPX and NDX. Price broke out above the DTL but has been very reluctant to get upside momentum.
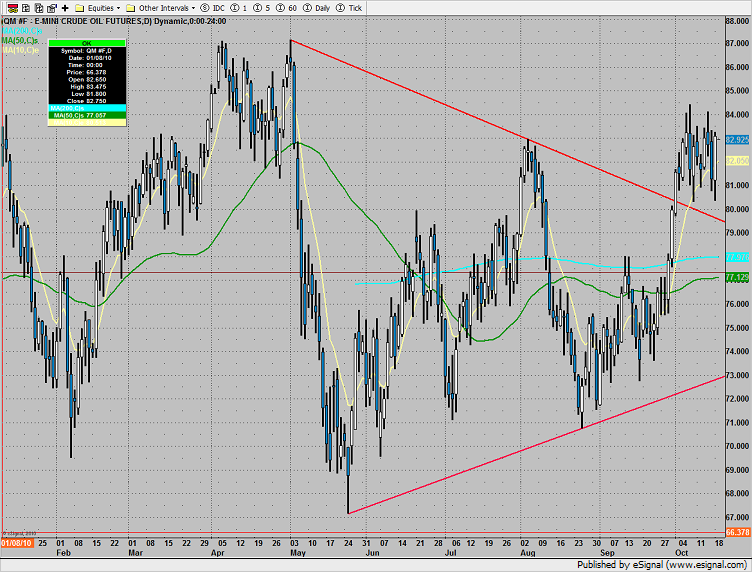
Oil had a strong day, especially considering the early strength in the US dollar.
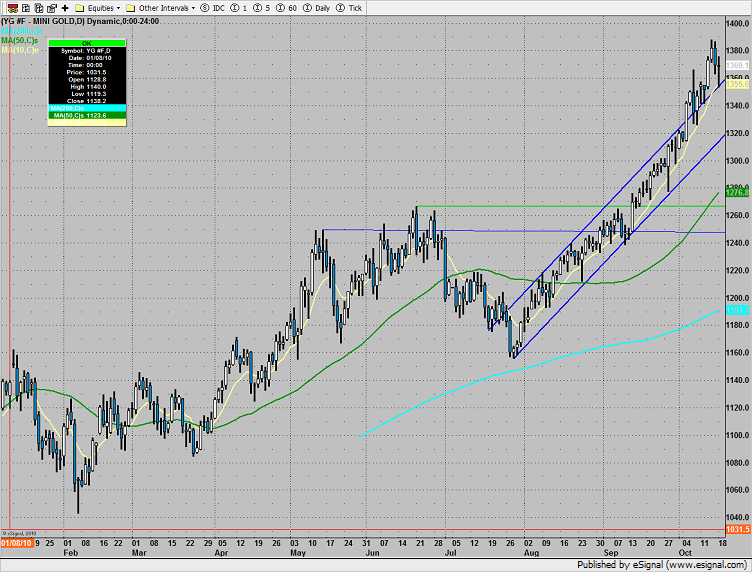
Gold remains positive but very extended. A sharp correction could be very close at hand.
Market Outlook for October 19, 2010
October 18, 2010
|In Tradesight