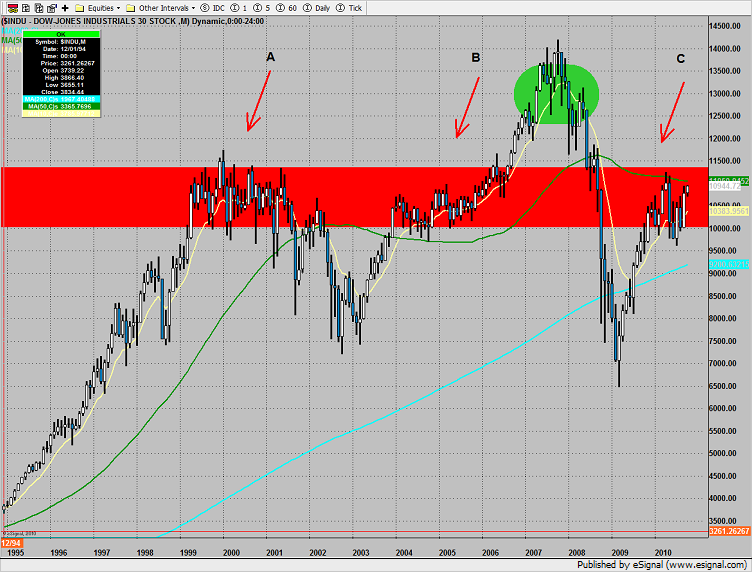
For some perspective, let’s examine the very long term monthly chart of the Dow Industrials. The first thing that should jump out is the very well defined band of trading between 10,000 and 11,500. This is represented by the red band on the chart. On the left side of the chart, at point A, there was an extended period of accumulation that ultimately failed when the tech bubble burst. The ensuing collapse ran its course and price reentered the trading band at point B. In 2006 the Dow was finally able to breakout over the trading range to make new all time highs. The index churned, ultimately failed and then truly collapsed in 2008. Currently, price is back in the primary trading range with an upward bias. While the financial commentators may be bubbling with enthusiasm, market sentiment remains very negative. Alternative asset classes like bonds and gold are all at or near range high which means that the FOMC fire hose of liquidity is lifting all boats. If one is onboard with this thinking, is the Dow in a bull market or a bounce? It is unlikely that the Dow is in a new bull market until the trading band has been exceeded and confirmed by asset reallocation swapping from bonds and gold into equities. At present, the Dow Industrials have been in the trading range (red band) for about one year. The two previous penetrations at point A and point B lasted for 2 ½ years before leaving the range. And for those keeping score at home, the time spent above the trading band (green bubble) between 2006 and 2008 also lasted for approximately 2 ½ years.
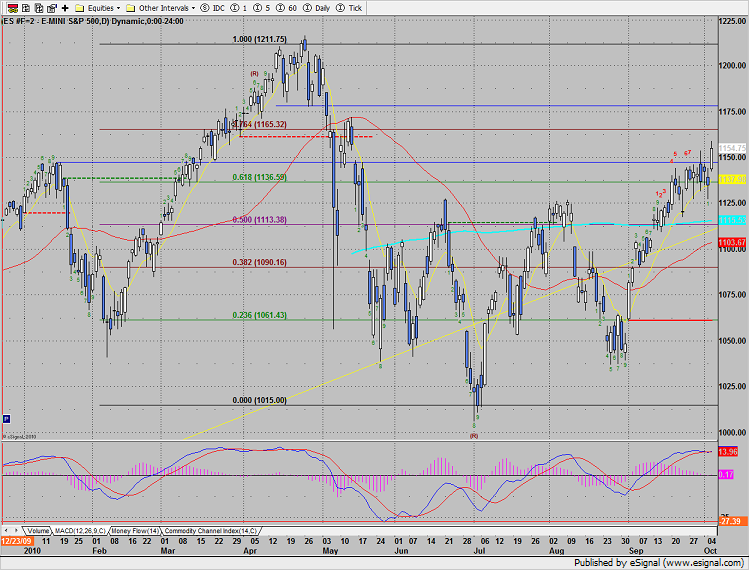
The SP broke above the recent trading range and added 20 on the day to settle at a new high. The next area of interest is the 1165 fib.
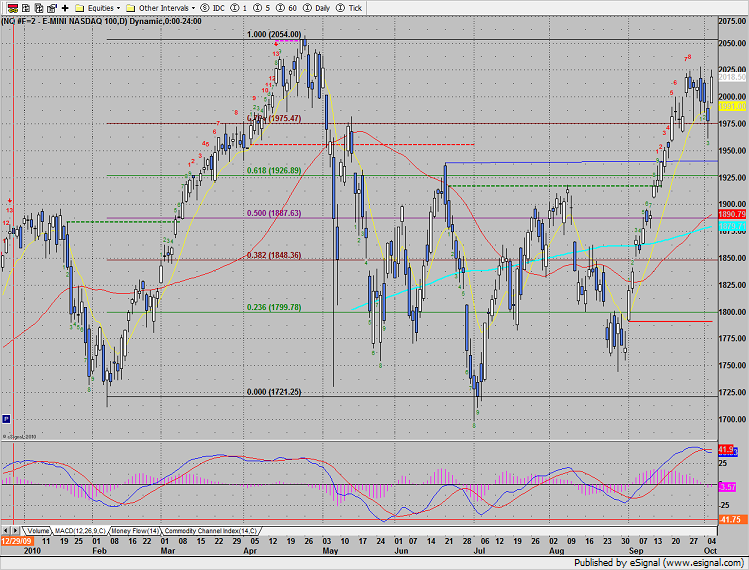
Naz was up 41 on the day but neither recorded a new high nor a new high close. The MACD has turned negative.
Gold stocks continue to outperform on the multi sector comparison chart:
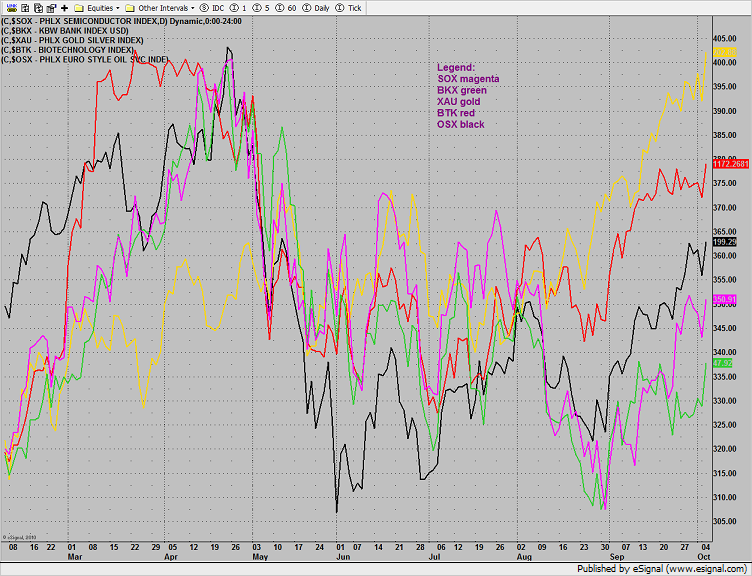
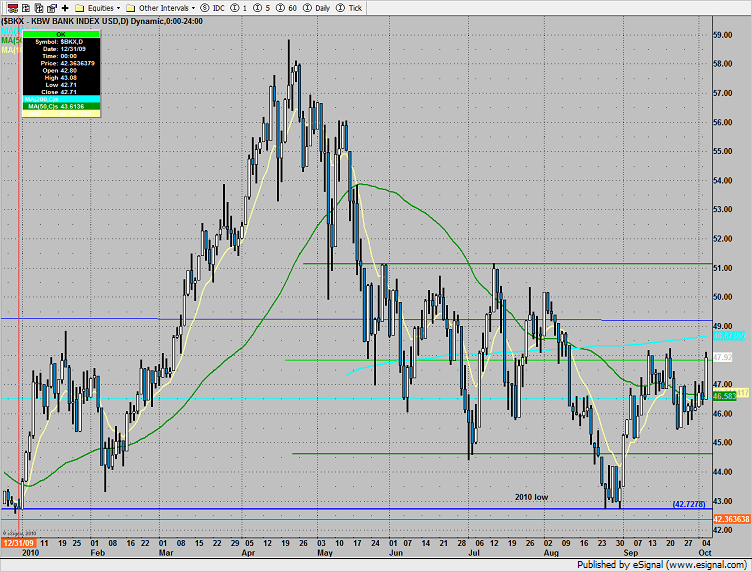
The BKX was as top sector, performing equally with the XAU. The key sector was up 3% but did not break the recent range or record a new high close.
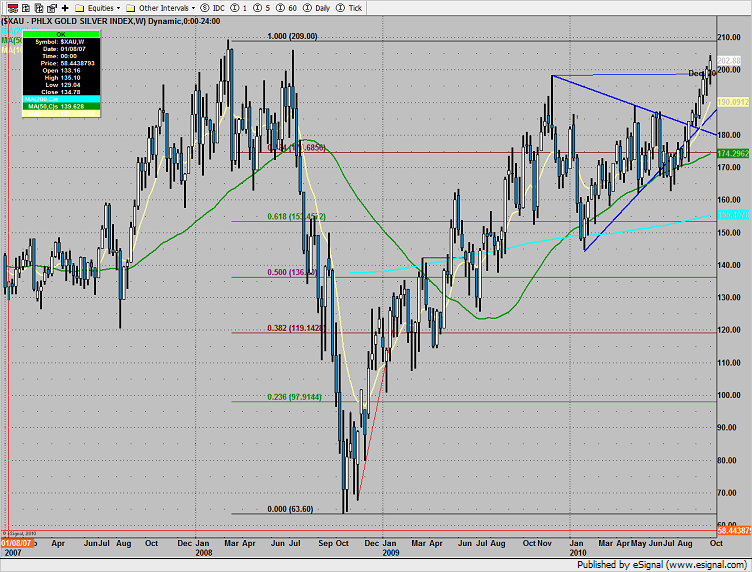
The XAU made a new high on the move but not a new all time high. Below is the long term weekly chart showing the fibs and prior high water mark.
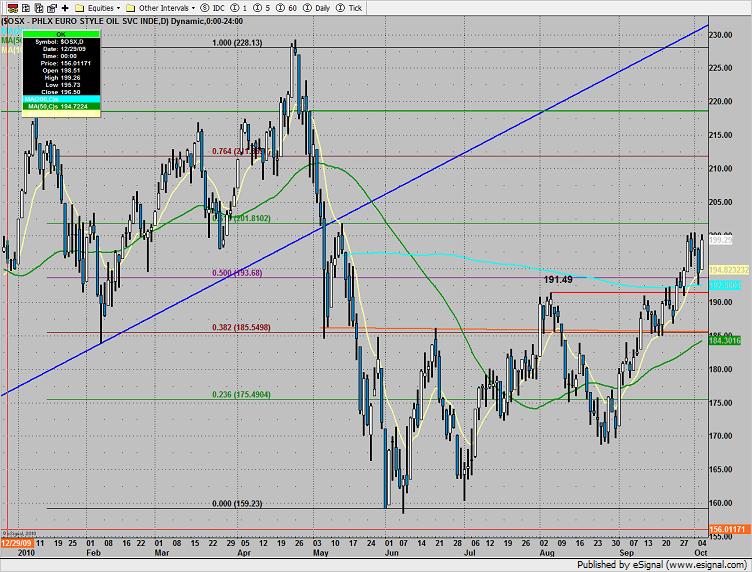
The OSX was just short of a new high. Set an alarm for a break over 200.50.
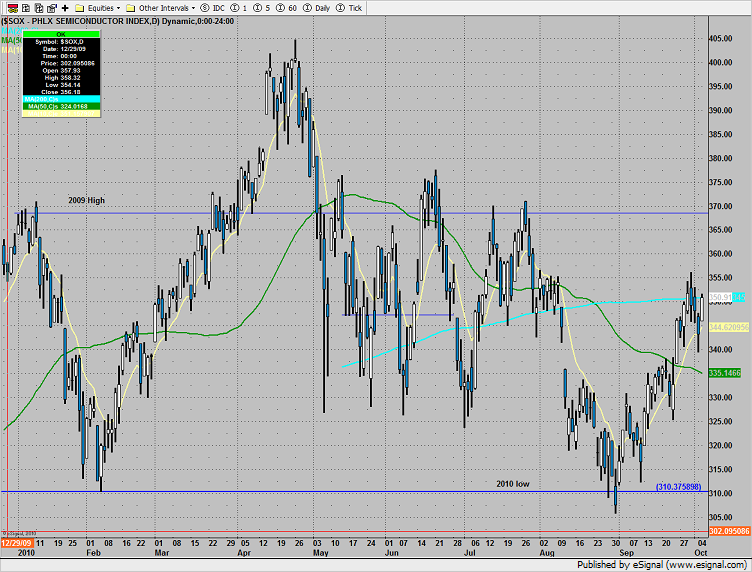
The SOX, performing in-line with the NDX settled right at the 200dma.
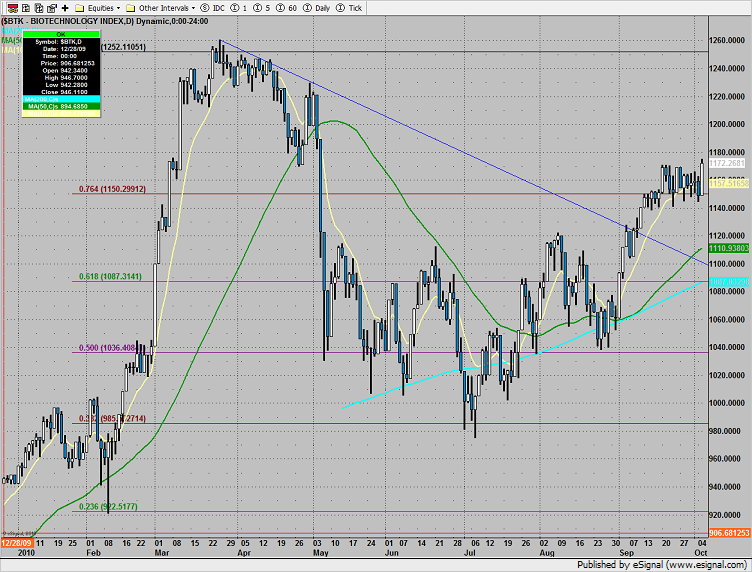
The BTK could provide some setups. Price settled right at the prior range high. Monitor this sector for breakout trades.
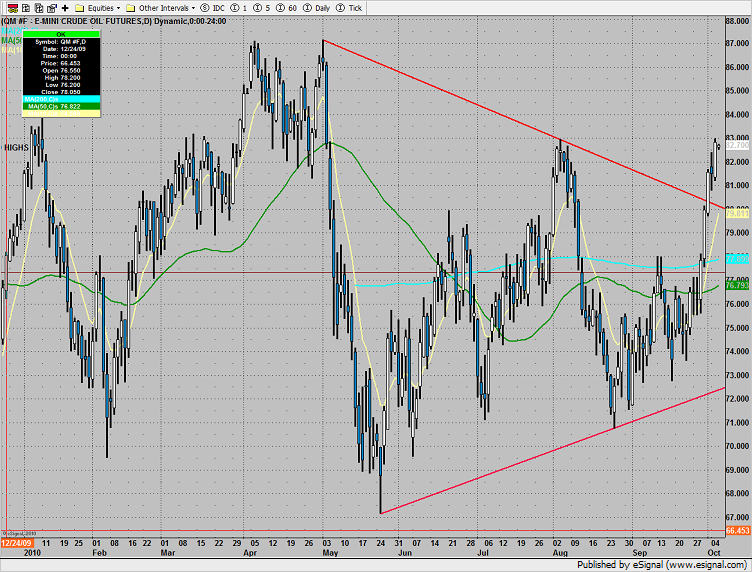
Oil continued its pattern breakout, making a new high close on the move.
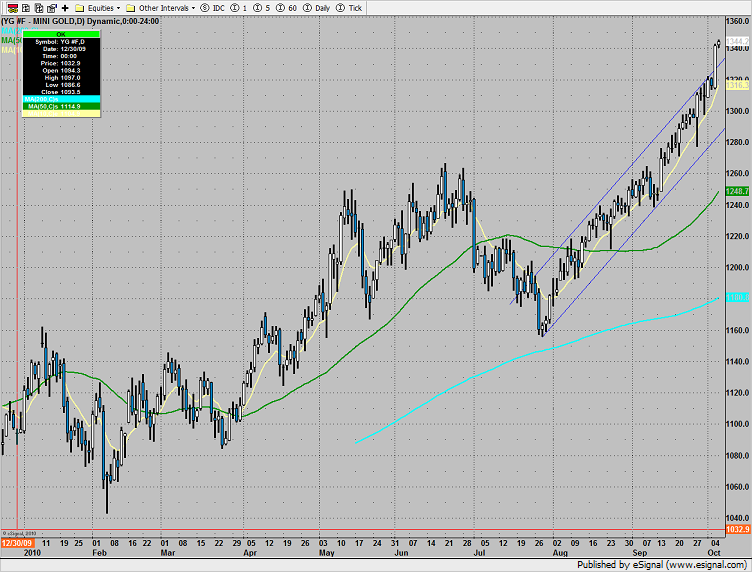
Following the quantitative easing from the central bank of Japan, gold exploded to a new all time high. The angle of assent has left the well organized channel and is beginning to get steep.
Tradesight Market Preview for October 6, 2010
October 5, 2010
|In Tradesight