End of Quarter Window Dressing Discussion
Markets are about reality, and what I mean is that you have to accept certain things about market behavior. For example, options expiration plays a key role during the week of expiration and on expiration Friday itself. To ignore that is to ignore key information that can help you trade better.
Another key reality is that the end and beginning of quarters tend to have certain characteristics for stocks and the indices. Essentially, the idea is that we commonly see the market go flat for the last couple of days of a quarter as the major funds have their positions placed and the market is largely sitting where they want it to for the end of quarter statements for clients. What is also important here is to realize that after the quarter does end, things start to pick up to make up for the fact that the market was artificially contained. Here's an example of how this can look, and there is no magic formula for whether it will be one day or three days or five days.
This time, it was five days. Here's the S&P 500 showing trading from last Friday through the end of this Thursday, which was the last day of September and Q3:
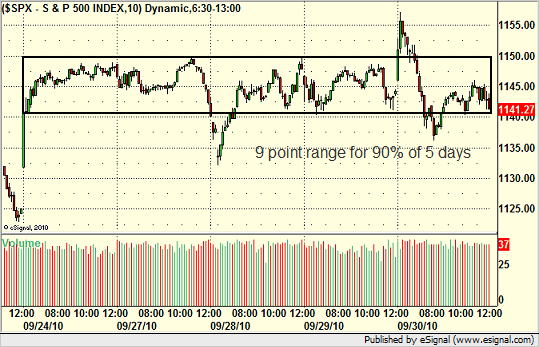
Basically, 90% of that week was in an impossibly narrow 9 point S&P range. We had a spike down Tuesday that returned to the main range and a spike up Thursday that did the same (both gave us nice opportunities, include several big stock winners on the gap down Tuesday and almost a 20 point winner on the NQ futures contract on the gap up Thursday.
This is not normal market behavior. You would be hard-pressed to find something similar that wasn't either a significant holiday week or an end of quarter. The fact that this went a full five days is pretty amazing. It wasn't apparent after Friday, the first day, and Monday was a disappointment, but after Tuesday, you had to see the rest coming.
Meanwhile, let's look at how Q3 started back at the beginning of July. Note that the Fourth of July holiday was right at the start, so really the move starts after everyone gets back.
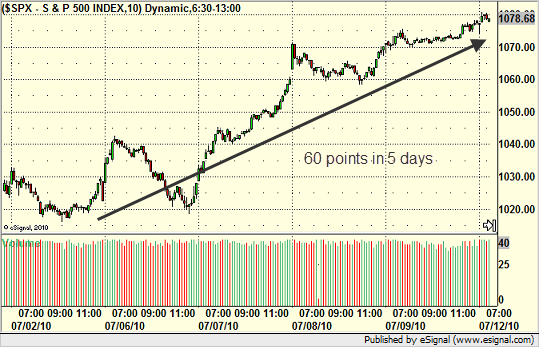
That's a nice move and was very easy to make money in. 60 points in about 5 days.
So these things happen, but they don't tend to happen at random times. The first days of a quarter are commonly good periods of movement (doesn't have to be the very first day, but usually pretty quick). The end of the quarter can be slow, whether it be just a day or two or more. You need to understand that and factor that into your trading. I had a successful week because I saw this early and adjusting my trading accordingly. I focused on the opening 90 minutes and did well on the two days with the gaps, but was fairly picky beyond that.
Let's look at the end/beginning of the last four quarters on a daily chart of the S&P:
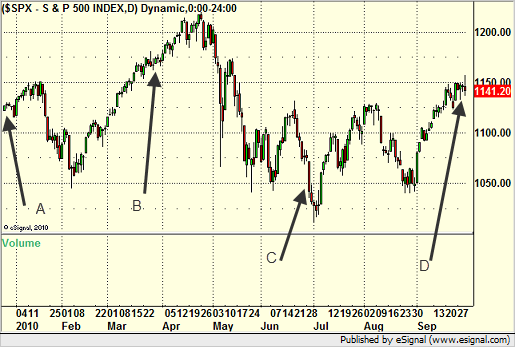
Point A is the end of 2009/start of 2010. The last week of the year is almost always slow with so many traders away and most people having done their buying and selling for tax purposes in advance. Meanwhile, note that we did start moving once January hit. That one isn't rocket science as there are several factors going on.
Point B is the end of Q1/start of Q2. See how we went flat for a couple of days at the end of the quarter (almost a week); INSERT INTO `wp_posts` (`ID`, `post_author`, `post_date`, `post_date_gmt`, `post_content`, `post_title`, `post_category`, `post_excerpt`, `post_status`, `comment_status`, `ping_status`, `post_password`, `post_name`, `to_ping`, `pinged`, `post_modified`, `post_modified_gmt`, `post_content_filtered`, `post_parent`, `guid`, `menu_order`, `post_type`, `post_mime_type`, `comment_count`) VALUES then ran when the quarter started?
Point C is the end of Q2/start of Q3. The end of Q2 was the exception, as the market was still moving around wildly until the last day of the quarter. But, as I already showed, we did move...up...sharply once the next quarter started.
Point D is now. We just suffered through five horrible days and came out unscathed. This next week is a good time to concentrate.
Tradesight Stock Picks Review from Thursday, September 23
NVDA opened just above the trigger, so no play, but worked great.
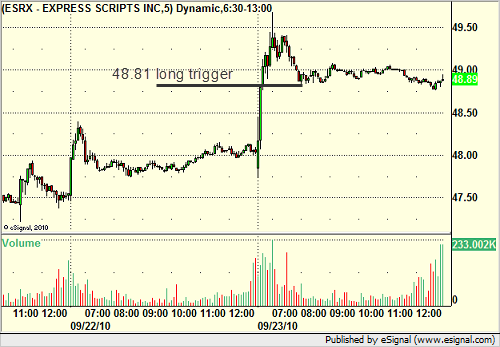
ESRX worked:
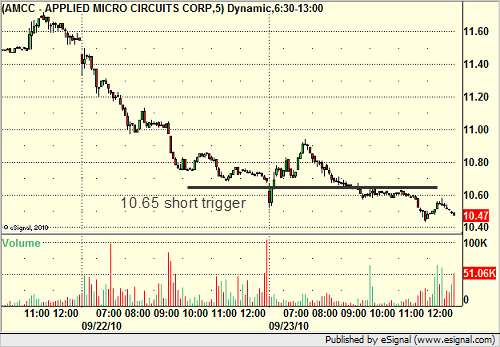
AMCC gapped under the trigger, filled the gap, then triggered and worked:
ATLS gapped under the trigger, no play.
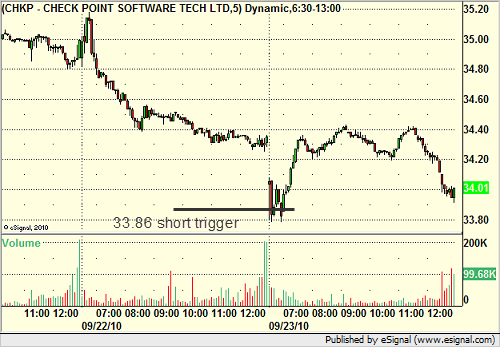
CHKP gapped down but opened just above the trigger, swept, and that was that:
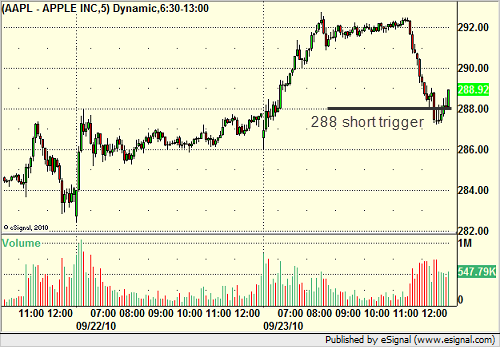
In the Messenger, AAPL worked great:
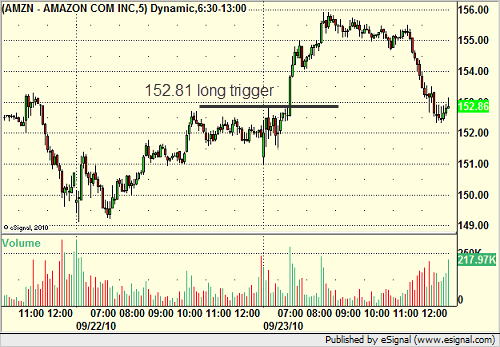
AMZN worked great:
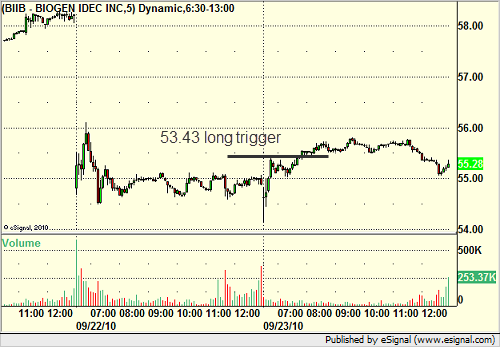
BIIB worked:
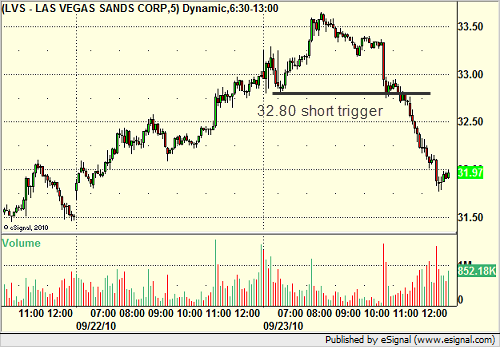
Rich's LVS short worked:
His AAPL short in the afternoon worked for almost a point:
A Night of Scalping...
Lots of little winners on calls and scalp calls based on what I said up front were pretty limited setups for the night. See GBPUSD, USDCAD, and NZDUSD below.
I put a note in the Messenger today, but I will repeat here. As we draw closer to the launch of the Tradesight 4.0 website, you will start to see some promotional emails and newsletters go out. There are two price changes on the new site (Swing and Forex). The main Forex service is going up $20 per month to $149. This will NOT affect current subscribers at all. You will continue to get the $129 rate indefinitely, as will anyone that signs up before the new site is in place (sometime before Halloween). Also, the Total FX package (the one that includes the Seeker/Comber for advanced active traders) will also go up $20 to $219. If you are currently an FX subscriber ($129 per month) and later want to bump to the Total FX, we will still allow that upgrade to the existing $199 price (instead of the new $219). No rush. This is not about current subscribers. This is related to some new relationships and items that Tradesight has recently entered going forward. We like you guys just the way you are. ;-)
New calls and Chat tonight.
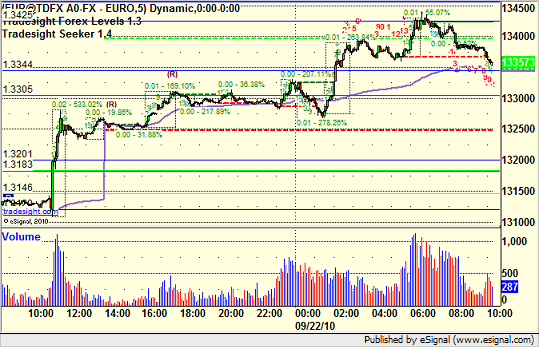
24 Hour EUR/USD
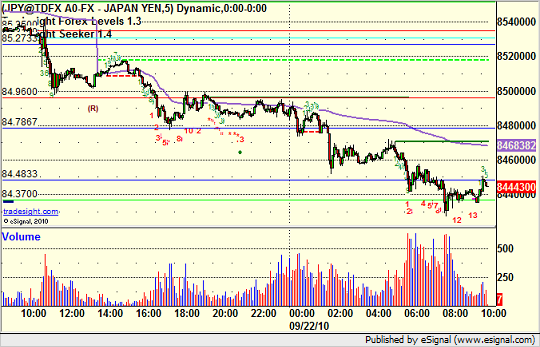
24 Hour USD/JPY
24 Hour GBP/USD
Triggered long very early at A, hit first target at B and beyond. Added additional call later, triggered short at C, hit first target at D, second half stopped:
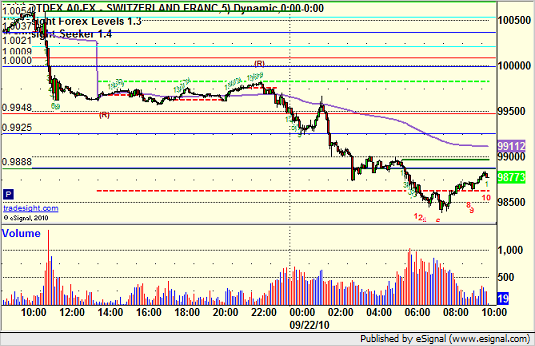
24 Hour USD/CHF
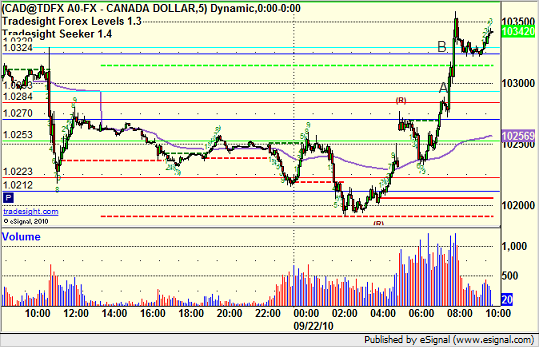
24 Hour USD/CAD
Perfect Value Area move from A to B:
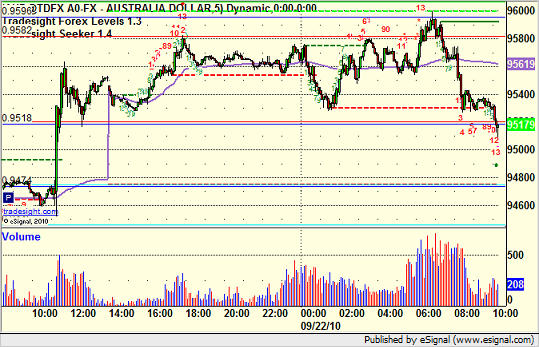
24 Hour AUD/USD
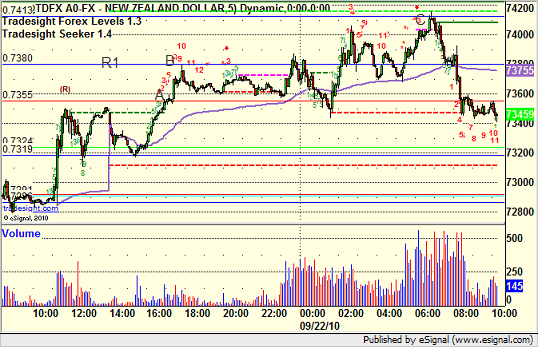
24 Hour NZD/USD
Scalp Idea in the Messenger early yesterday evening triggered over UBreak at A, hit R1 exactly at B. Although that's about all you want out of a scalp, just note how well it later used R2 at C:
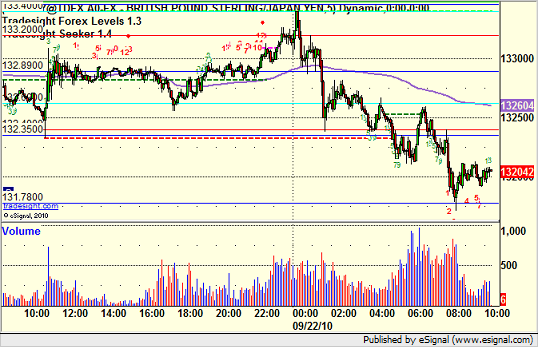
24 Hour GBP/JPY

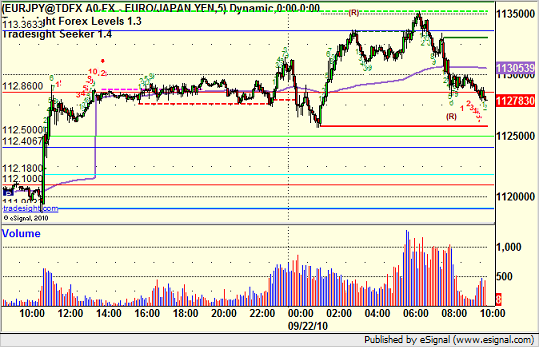
24 Hour EUR/JPY
24 Hour GBP/CHF
GBPUSD Winners in Both Directions
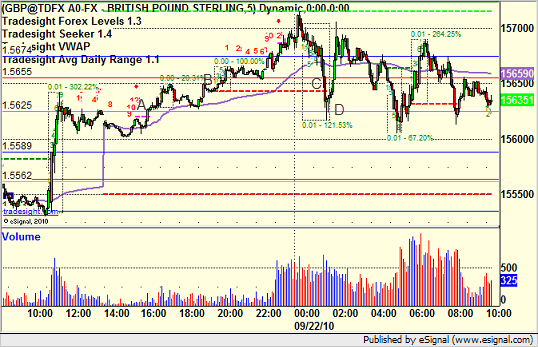
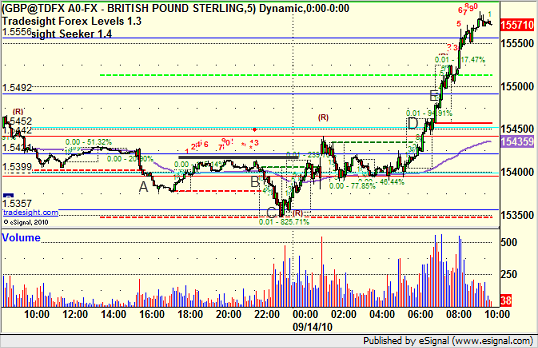
At Tradesight, there is a reason that we make two calls every night. It isn't our job to guess whether the US Dollar is going to get stronger or weaker. We should have trades in place for either option. This worked to our benefit last night as we collected over 100 pips (and still going on one trade) without having to watch the market. Here's the summary from our daily report:
A nice night based on our calls in the GBPUSD. First, it triggered short early at A, which would be for half size due to the time of day, but it came back, never stopped (stop was over black line); INSERT INTO `wp_posts` (`ID`, `post_author`, `post_date`, `post_date_gmt`, `post_content`, `post_title`, `post_category`, `post_excerpt`, `post_status`, `comment_status`, `ping_status`, `post_password`, `post_name`, `to_ping`, `pinged`, `post_modified`, `post_modified_gmt`, `post_content_filtered`, `post_parent`, `guid`, `menu_order`, `post_type`, `post_mime_type`, `comment_count`) VALUES gave you another entry chance at B, and hit the first target at C. We adjusted our stop to breakeven on the second half and that stopped overnight. The long call triggered at D, hit first target at E, and we still have the second half with a stop under 1.5525, which is holding nicely in the money:
Stock Triggers Recap from August 31, 2010
Here is a recap of the stock triggers from the Tradesight Stock Report and Real-Time Messenger for Tuesday, August 31, 2010. This includes all triggers.
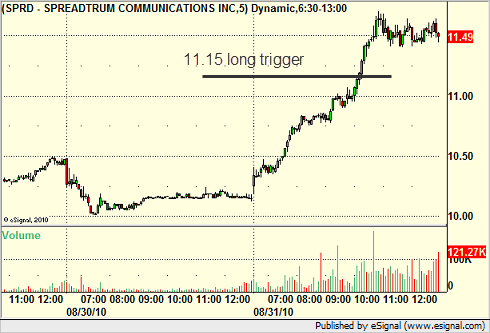
Off of the report, SPRD worked nice:
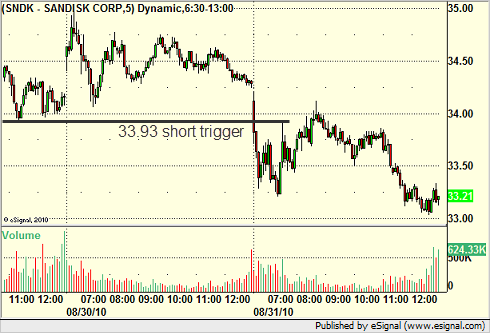
SNDK short worked:
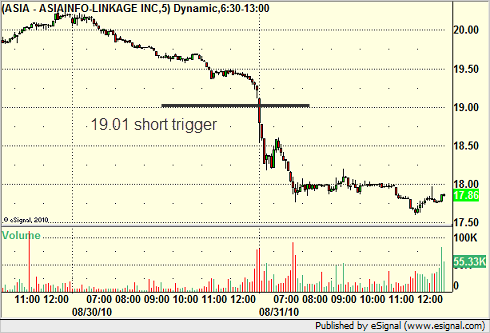
ASIA worked but triggered right out of the gate:
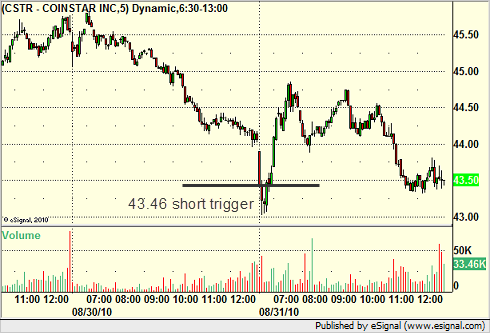
CSTR went enough for a partial:
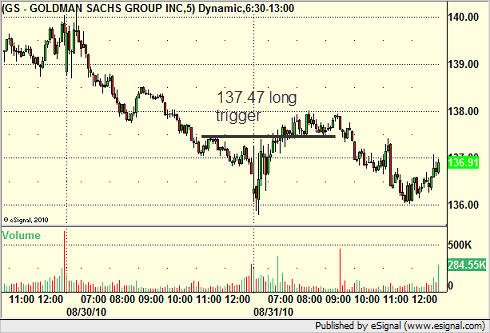
In the Messenger, GS gave me a small winner, but finally gave up on it:
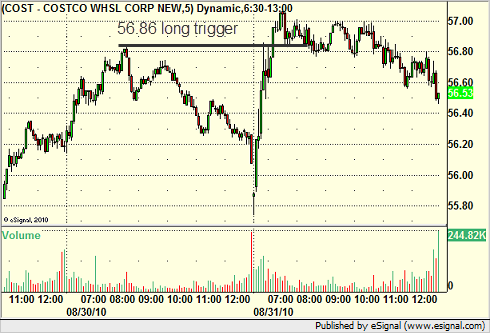
COST went enough for a partial, that's it:
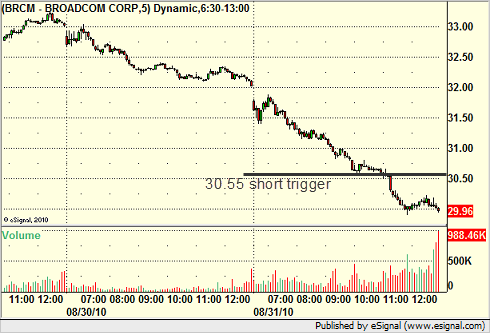
Mark's BRCM worked:
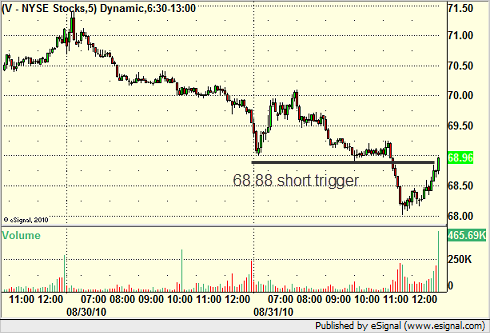
Rich's V worked:
GOOG didn't work:
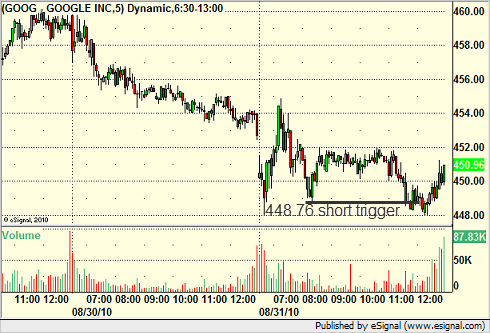
Overall, a very nice day to close out August.
ES Classic Futures Calls with Value Area, Pivot, and Gap Fill...
It's been a slow week or two in the markets with volume on the light side and afternoon activity much flatter than normal. That doesn't mean any one day can't give you a surprise, and fortunately, Mark Likos spotted a classic ES setup today and called it for our subscribers.
The market gapped down in the morning and was mostly flat over lunch. It rallied up after lunch to fill the gap, hitting the Pivot (dark blue line); INSERT INTO `wp_posts` (`ID`, `post_author`, `post_date`, `post_date_gmt`, `post_content`, `post_title`, `post_category`, `post_excerpt`, `post_status`, `comment_status`, `ping_status`, `post_password`, `post_name`, `to_ping`, `pinged`, `post_modified`, `post_modified_gmt`, `post_content_filtered`, `post_parent`, `guid`, `menu_order`, `post_type`, `post_mime_type`, `comment_count`) VALUES which was just above and inside of our Value Area Low:
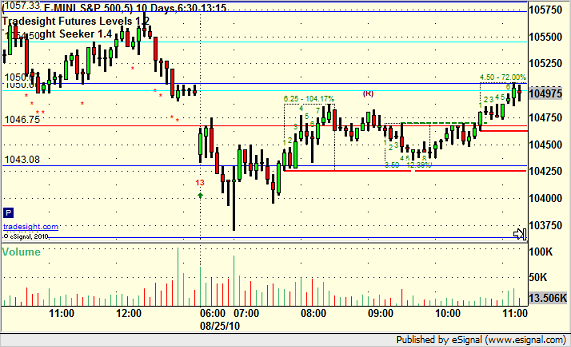
What does this set up for us? When a market fills a gap, it is the resolution of a necessary technical move (80% of gaps fill the same day). When they stall out at the Pivot, they are identifying that level (the "Balance of Play" from the prior session) as important. Those two items basically set a very specific wall and complete the energy move of the gap fill. This means that the market is now free to head either direction, but in this case, a move to new highs gives you a break above the Pivot now that the gap is filled, and it gives an entry into the open part of the Value Area. So, Mark called the long above that level, and the move worked perfectly to the other light blue line, which marks the high of the Value Area:
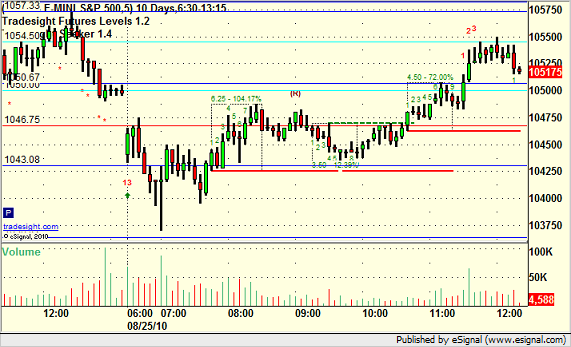
These are the types of high-probability setups that we like to keep our subscribers focused on, even though they haven't been happening as much in August. Don't forget, wait for the market to do what you need, because it isn't going to move how you want. Clean setup, one of the best of the week, and thus, a clean winner.
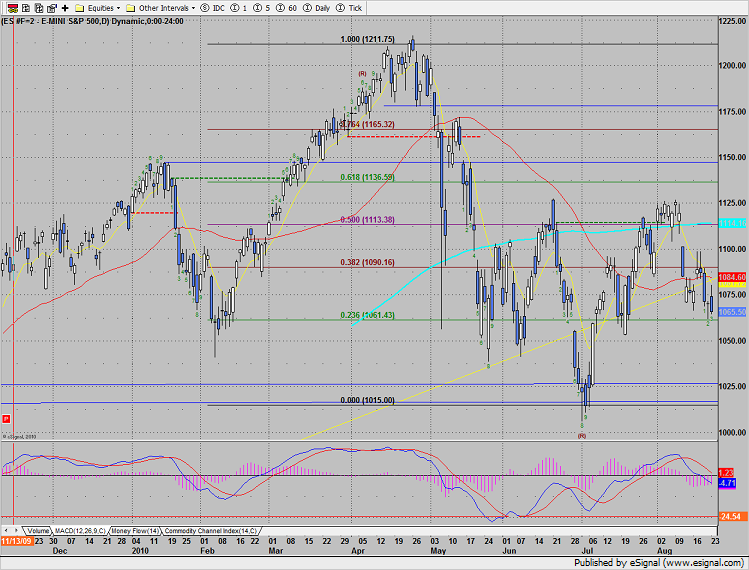
Market Outlook for August 24, 2010
The SP lost 4 on the day, making a new low close on the move. Price is now below and moving away from the 50 and 200 daily moving averages. The recent MACD sell signal has been validated by the close under the zero line. 1061 is a Fibonacci level and also prior support. Treat this level as a pivot under which the momentum could accelerate.
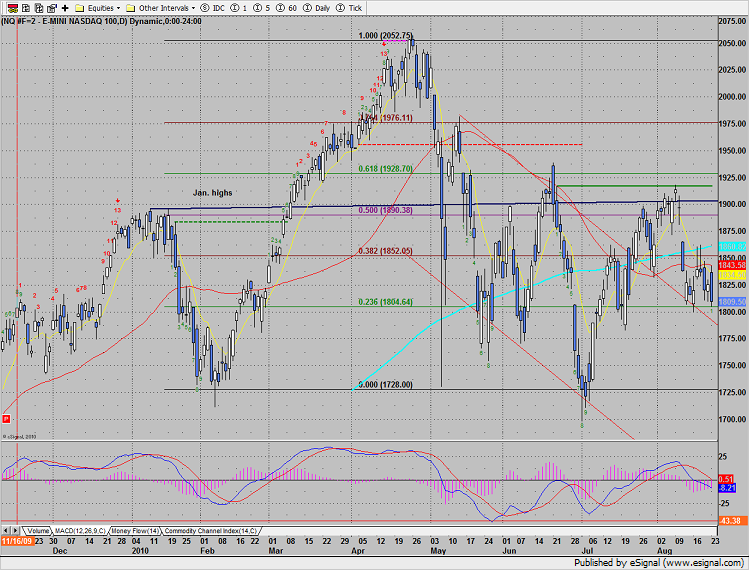
Naz also made a new low close on the move. 1800 is near term support with 1750 next. Fibs have been added to the chart. Note that the MACD has closed below the zero line.
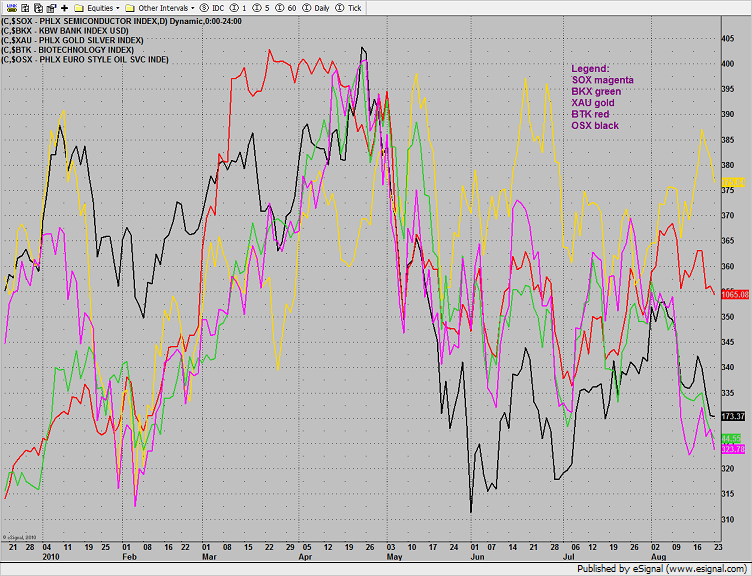
The multi sector daily chart shows the relative weakness in the SOX.
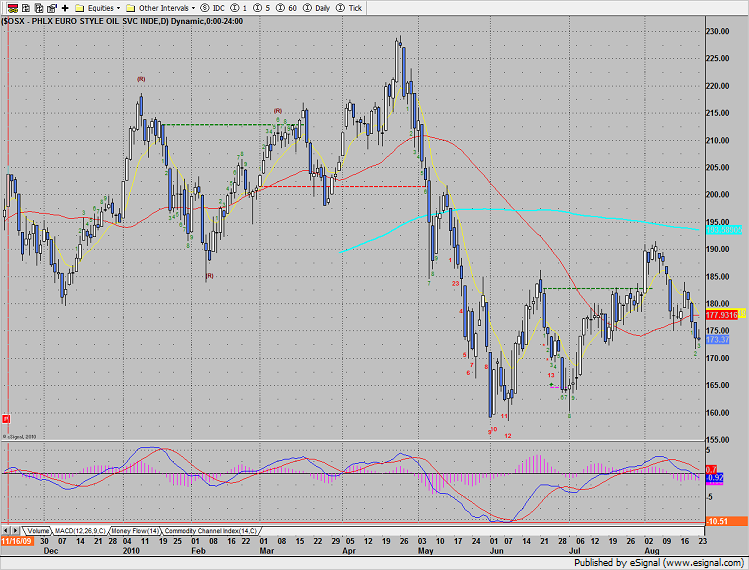
The OSX was the best sector posting a small range inside day.
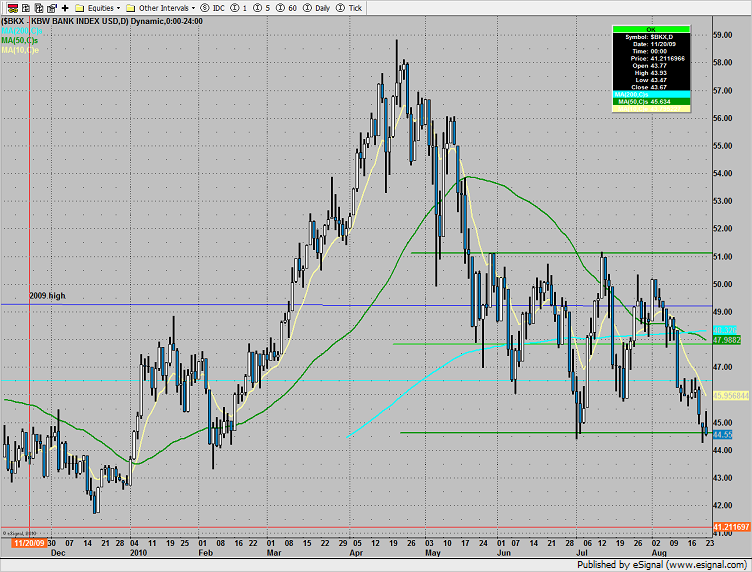
The BKX closed right at the lower edge of the trading range. This is the lowest close since February.
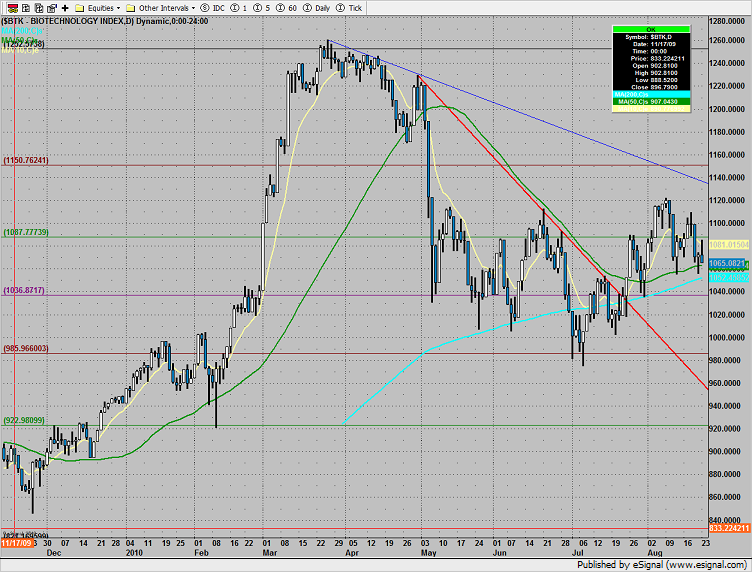
The BTK closed just above the key 50 and 200dmas. Look to this index for leadership if the market turns higher from here.
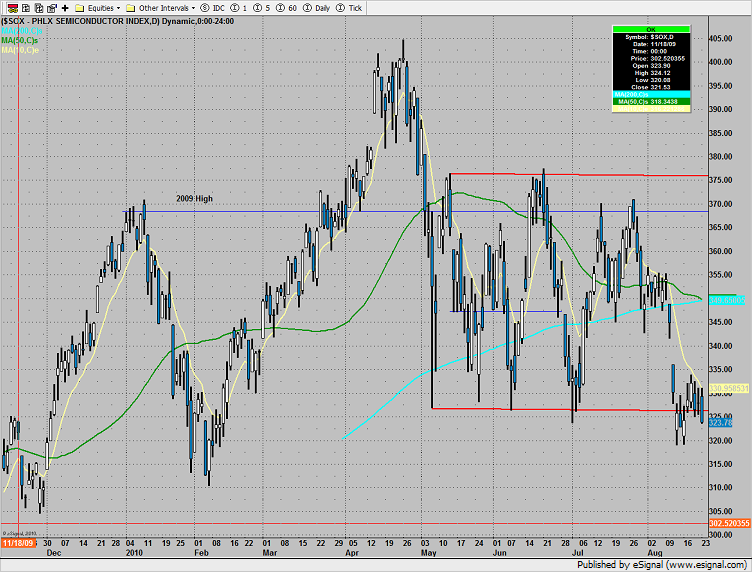
The SOX is gaming the lower boundary of the trading range. The leading index was weaker than both the broad market and Naz on the session.
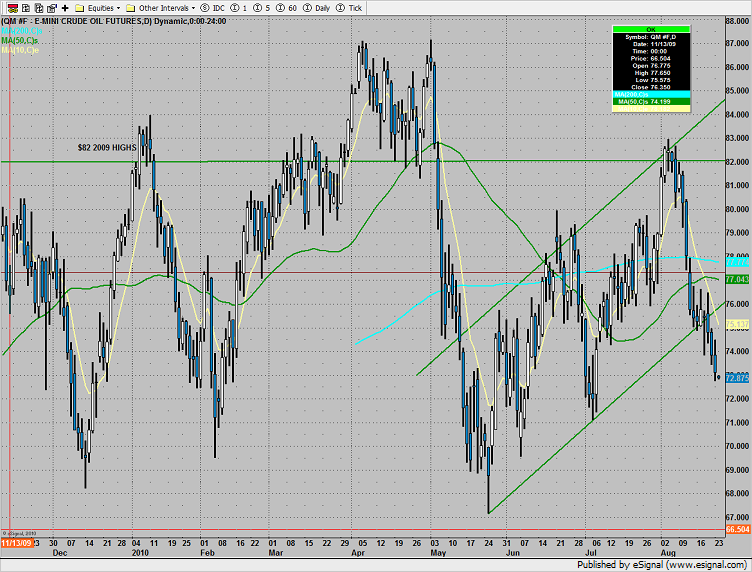
Oil continues to slowly breakdown.
Gold continues to show good relative strength during a seasonally weak time of year.
This is the chart to watch. Until the SOX shakes off its relative weakness, selling rallies in stocks will be easier than buying the dips.
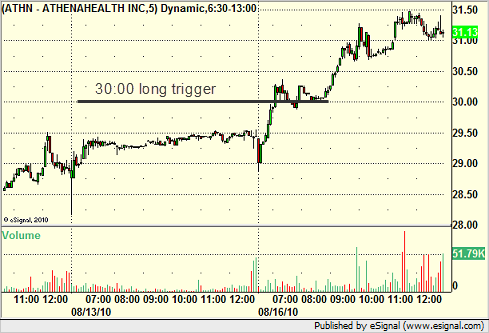
August 16 Futures and Stock Call Review: How to Make Money in a Light Volume Day
We had a nice winner today in our top long stock idea off of the report, ATHN:
But, that really doesn't tell the whole tale of how Tradesight helps you make money based on the market environment. Click on this link to get a presentation review of today's trading. Just press the Play button on that screen. The presentation is about ten minutes and walks you through how our Stock and Futures services can help you make money.
A Tale of Two MoBs
One of the tools that we follow closely is the Make or Break projection lines in e-Signal. This tool can be used to give you powerful targets on any trading symbol based on the most recent swing high and swing low. The tools plots price and time targets that are support or resistance if they are achieved.
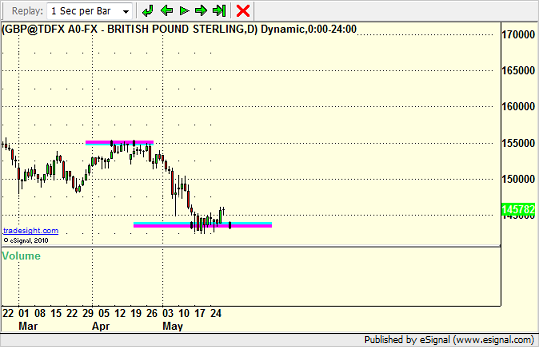
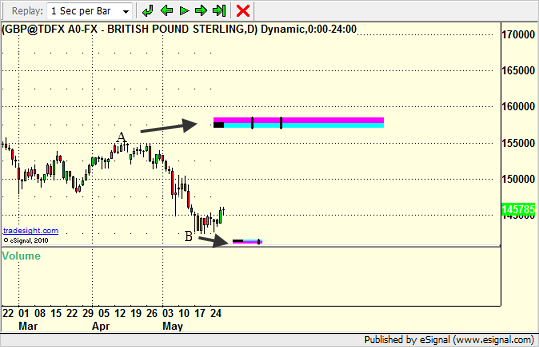
Sometimes, you can have MoB lines in both directions that are spaced far enough apart that both can hit. Let's take the example of the GBPUSD back in March. In this daily chart, I've drawn the MoB lines off of the swing high at A, which projects out as you can see, and the swing low at B:
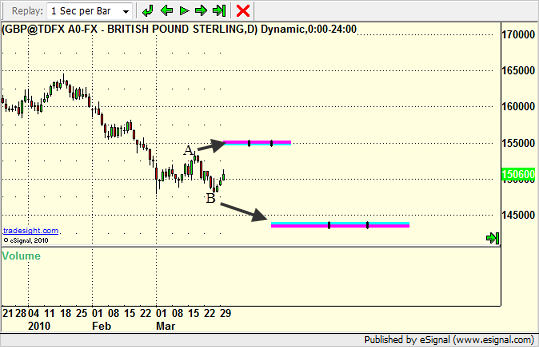
In this case, it is potentially possible that both lines could be hit. The ideal calculation is that the price will hit during the bar itself (not before or after); INSERT INTO `wp_posts` (`ID`, `post_author`, `post_date`, `post_date_gmt`, `post_content`, `post_title`, `post_category`, `post_excerpt`, `post_status`, `comment_status`, `ping_status`, `post_password`, `post_name`, `to_ping`, `pinged`, `post_modified`, `post_modified_gmt`, `post_content_filtered`, `post_parent`, `guid`, `menu_order`, `post_type`, `post_mime_type`, `comment_count`) VALUES with a real focus between the two black lines. Since these lines are spaced out, it would be possible, though certainly not necessary, that both could hit. Remember that the point of a MoB is a "potential" target if the market heads that way, not a likelihood that it will head that way.
As we moved into April, take a look at where price went:
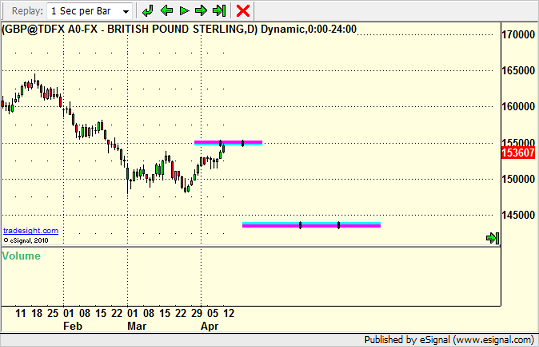
GBPUSD smacked right into the MoB between the two black lines, as projected. And as the month continued, it used that line as specific resistance:
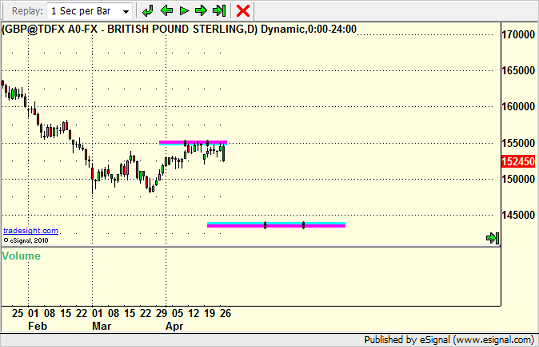
The question becomes, will that resistance point finally break, or will the trend resume? It is also important to note that the lower MoB was a thicker, making it a stronger projection. Here's the movement in May:
Right to the lower MoB...and...during the ideal time target between the black lines. Very interesting when you consider all of the news over the last month that a level projected in March could be hit so precisely.
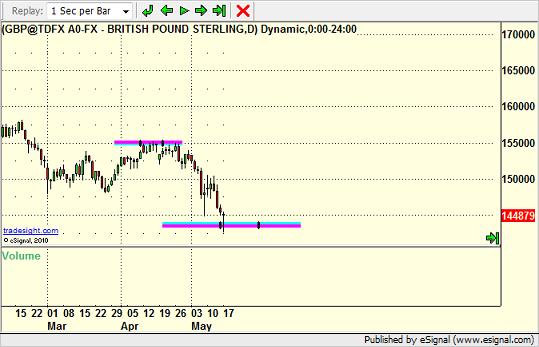
The rest of the month through today was spent using that MoB as support:
So now that we have new swing highs and lows, where are the new MoB projecting going forward? This is a little more interesting of a story. Have a look:
This time, both of the projections play out against the same timeline. The LOWER projection is much smaller and shorter, and obviously easy to hit. The upper line in general could be hit and would represent a change in trend if it were over the longer haul. But it isn't likely possible (although it is theoretically possible) to hit both in their ideal time projections, which makes this a battle.
We also are on the verge of a 13-bar sell signal on the US Dollar Index, which would be a powerful reversal signal if it fires in the next week or so. That would definitely increase the odds of a change in trend and point to that upper line hitting. We will continue to monitor.
You can follow us on Twitter for more details by clicking here, or take a free or full trial to our various trade calling and education services here.
Why The FX Day Starts at 5 pm EST
It is very important when trading Forex to understand the importance of the "start of the day" even though it is essentially a 24-hour market. In the equity and futures worlds, when you calculate key indicators such as the Pivot series and Market Profile (Value Areas); INSERT INTO `wp_posts` (`ID`, `post_author`, `post_date`, `post_date_gmt`, `post_content`, `post_title`, `post_category`, `post_excerpt`, `post_status`, `comment_status`, `ping_status`, `post_password`, `post_name`, `to_ping`, `pinged`, `post_modified`, `post_modified_gmt`, `post_content_filtered`, `post_parent`, `guid`, `menu_order`, `post_type`, `post_mime_type`, `comment_count`) VALUES you use the prior day's data from start to finish. In order to do the same in Forex, you have to establish what point is the end of the day and start of the next day so that you properly use the data from the trailing 24 hours.
Many charting platforms can be misleading because they allow people to set the timeframe axis of their chart up for their own timezone, and then they end up with calculations that are based on "midnight to midnight" in their zone. Many people also force their charts onto EST, which does not provide a good "midnight to midnight" day in Forex. If you do it that way, you're splitting the day in half.
The proper time for end of session/start of session is global rollover, which is 5 pm EST. Asia has not yet started, Europe is asleep, and the US banking day is over. This is the point of the lowest volume. It is also the point that banks in the intermarket system shut down to "settle" their trades from the prior 23 hours and 55 minutes or so. When you realize that technical evaluations and calculations need to be based on fixed factors such as a "day" of data, it becomes very important to recognize that this specific point is the start/end of a day. It also means that Forex can really be mapped into 5 clean daily bars as it opens at 5 pm EST on Sunday and closes at the same on Friday.
Tools that you use need to be able to make this adjustment to be valid. For example, we have an Average Daily Range tool that plots a range each day that is the six month average on each of our key Forex pairs. For those of us on the West Coast of the US, we need to be able to set that tool to start at 2 pm, which is 5 pm EST. By doing so, the tools starts drawing at that point and goes for 24 hours.
The chart below shows you today's GBPUSD with the Average Daily Range lines. The top line anchors to the high of the session since 5 pm EST (2 pm PST) because we're in the lower half of the day's range. The lower red line is the Average Daily Range target, which is often a key support point in the market. As you can see, during the "day" when you start this tool running at the right time, the GBPUSD moved exactly to that lower line and bounced:
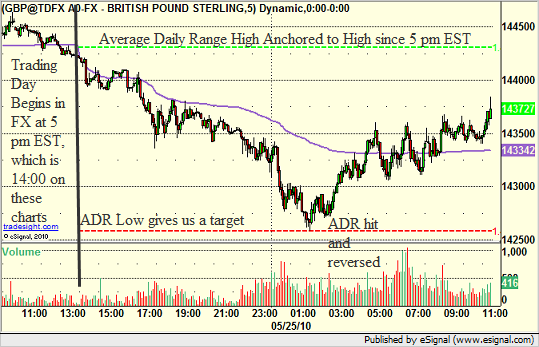
Had you used a different start of day, one that has less technical meaning to the market, the tool wouldn't have worked.
You can follow us on Twitter for more details by clicking here, or take a free or full trial to our various trade calling and education services here. Our next 20-hour Forex course starts in June.