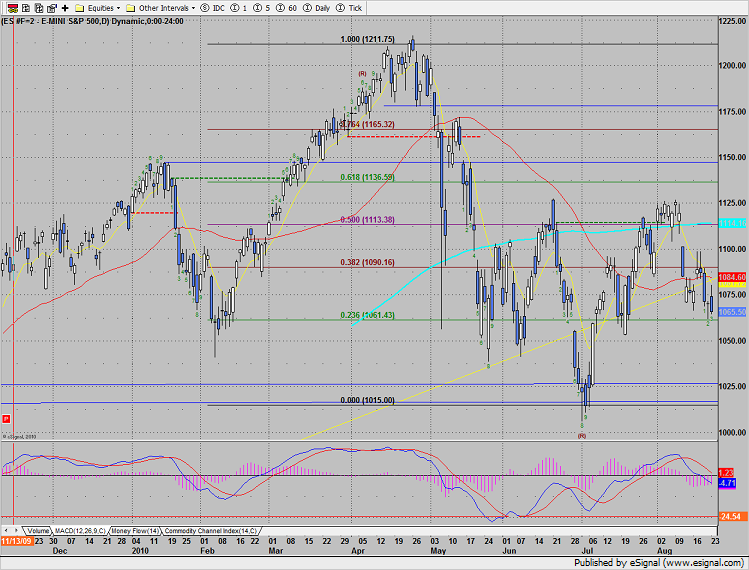
The SP lost 4 on the day, making a new low close on the move. Price is now below and moving away from the 50 and 200 daily moving averages. The recent MACD sell signal has been validated by the close under the zero line. 1061 is a Fibonacci level and also prior support. Treat this level as a pivot under which the momentum could accelerate.
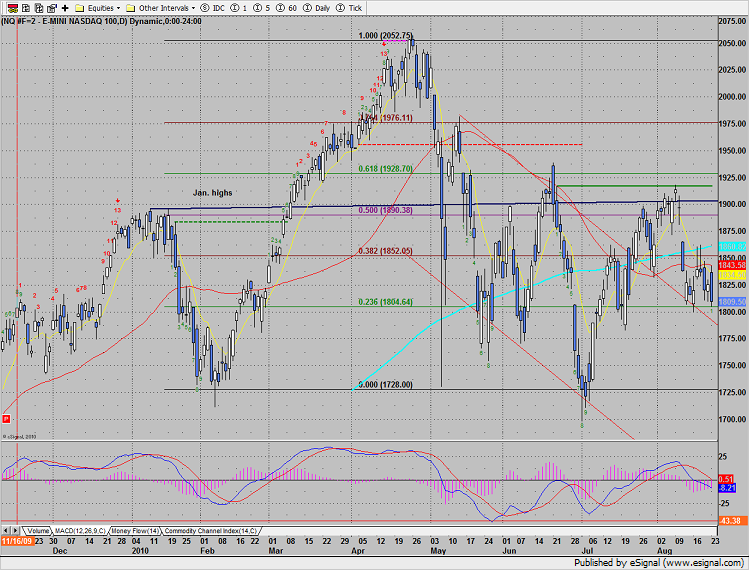
Naz also made a new low close on the move. 1800 is near term support with 1750 next. Fibs have been added to the chart. Note that the MACD has closed below the zero line.
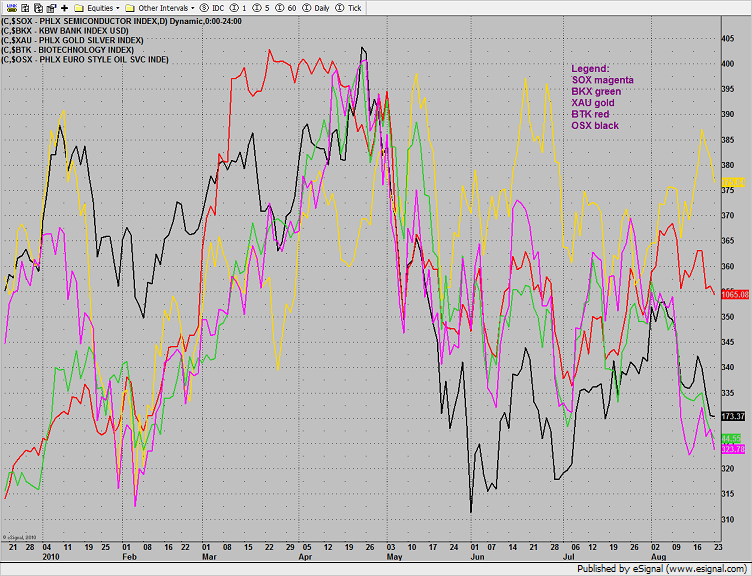
The multi sector daily chart shows the relative weakness in the SOX.
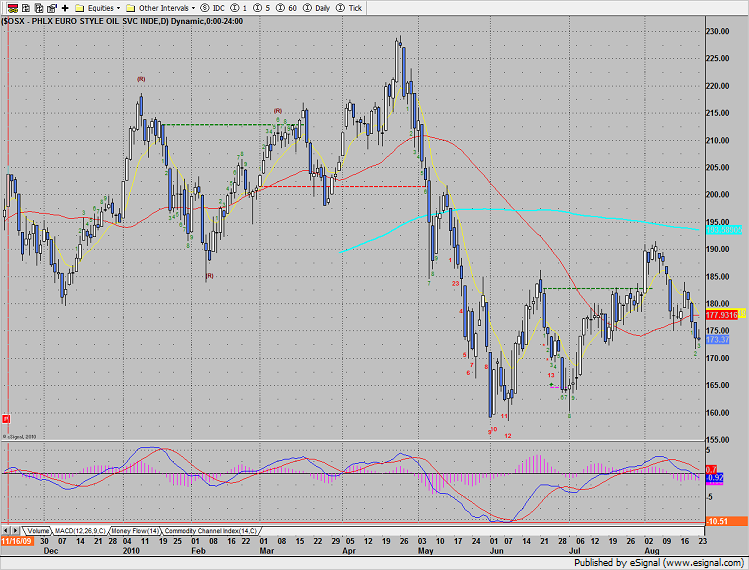
The OSX was the best sector posting a small range inside day.
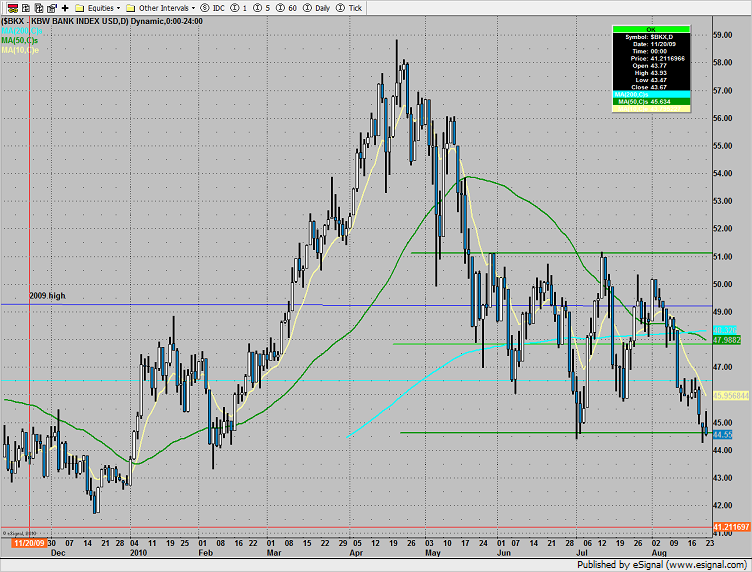
The BKX closed right at the lower edge of the trading range. This is the lowest close since February.
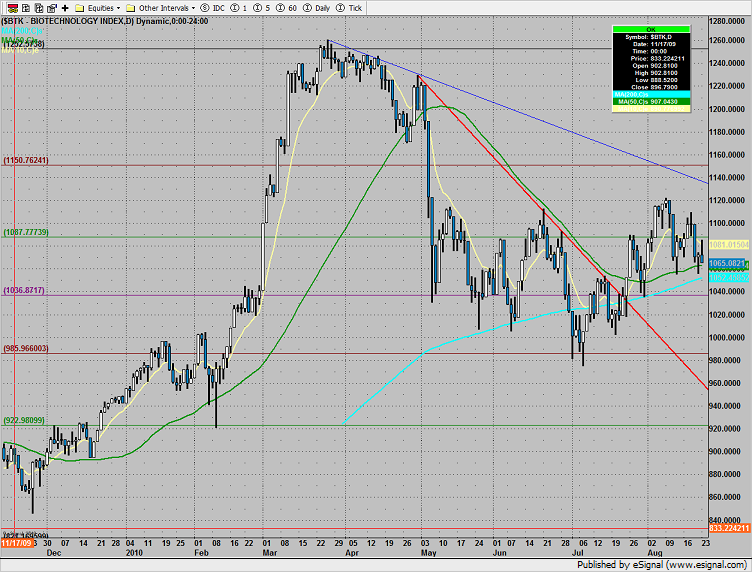
The BTK closed just above the key 50 and 200dmas. Look to this index for leadership if the market turns higher from here.
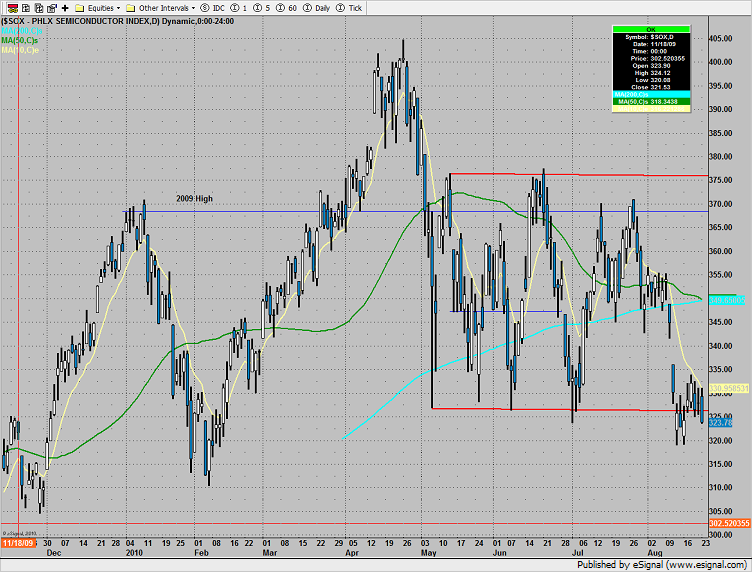
The SOX is gaming the lower boundary of the trading range. The leading index was weaker than both the broad market and Naz on the session.
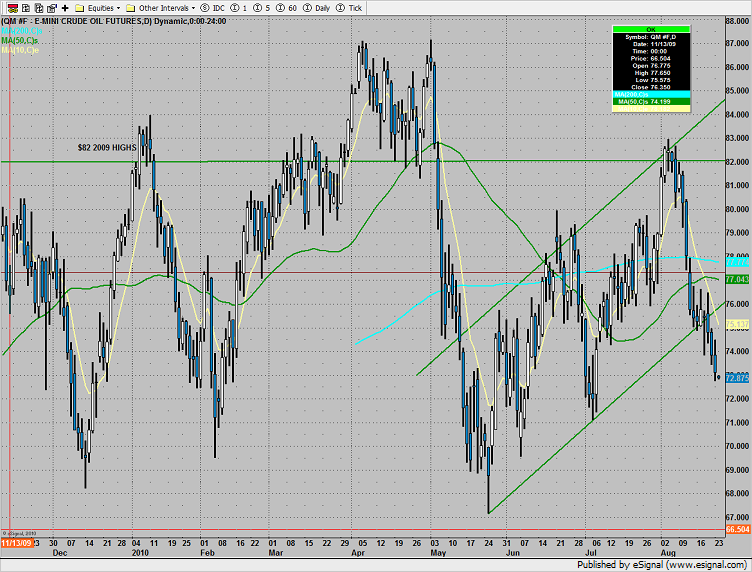
Oil continues to slowly breakdown.
Gold continues to show good relative strength during a seasonally weak time of year.
This is the chart to watch. Until the SOX shakes off its relative weakness, selling rallies in stocks will be easier than buying the dips.
Market Outlook for August 24, 2010
August 23, 2010
|In Tradesight