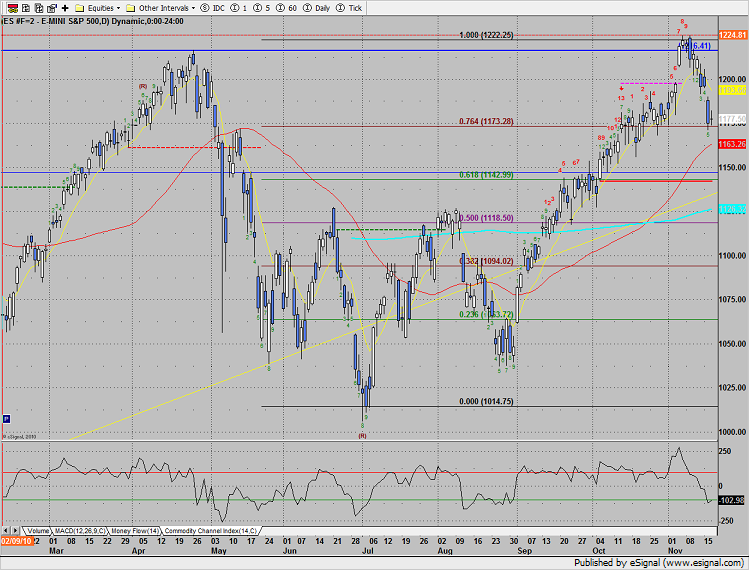
The SP posted an inside “measuring” day. This is very typical action following an impulsive move such as the prior candle. Just like 2 days ago, the pattern has energy stored in the pattern and can move forcefully when the range is resolved.
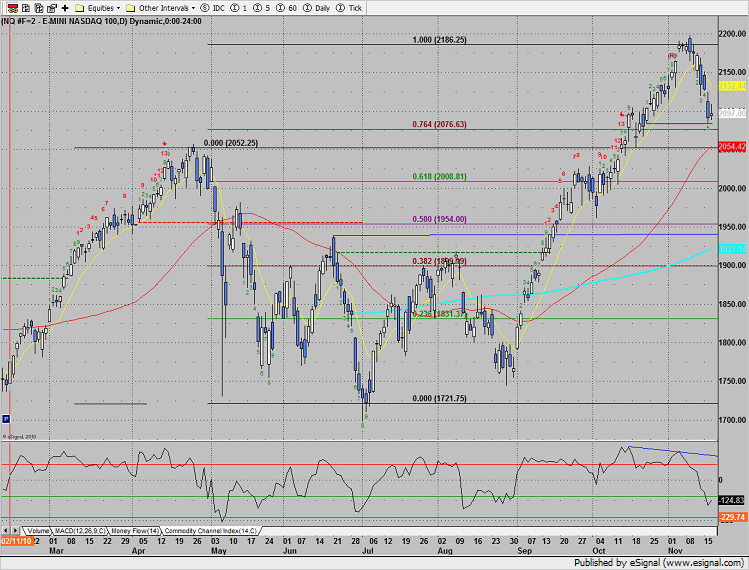
Naz also posted an inside day which has the same implications as the pattern in the SP. The static trend line (red) and then the April highs are the nearby support levels.
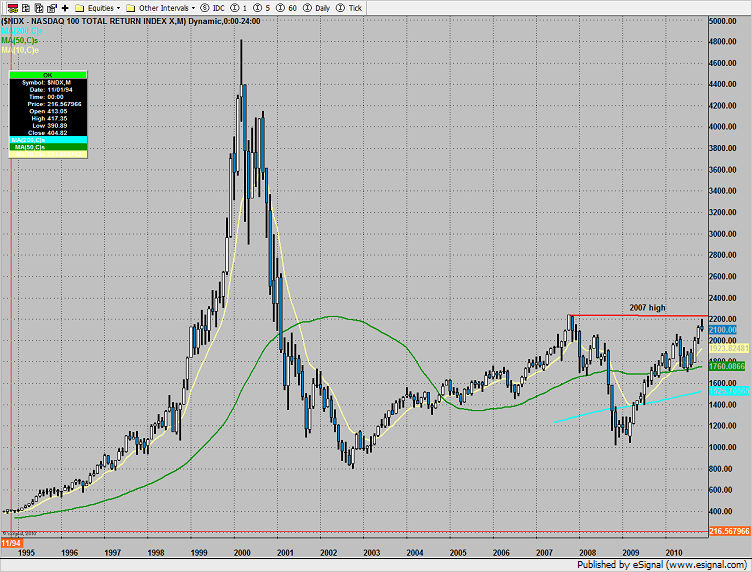
Below is the very long term monthly chart of the NDX100. There is a very key area just overhead. This is both resistance and a major breakout level. Set an alarm for 2239.
The financials remain very weak vs. the other major sectors.
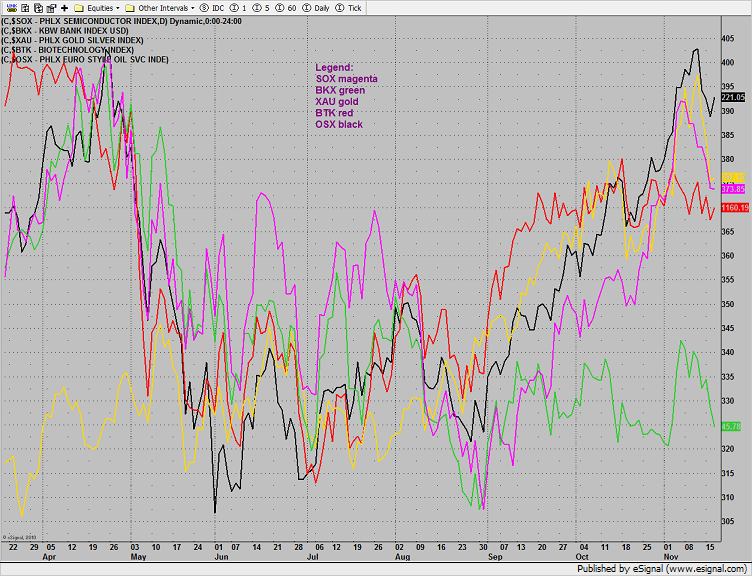
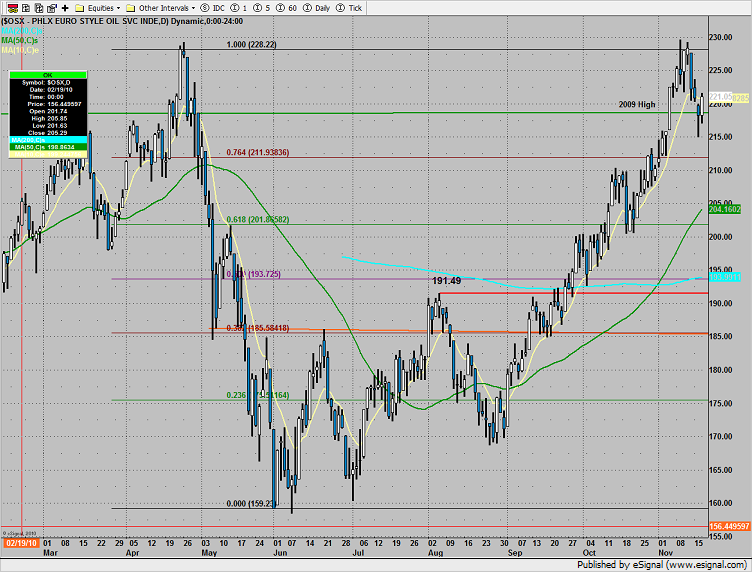
The OSX was top gun up 3 on the day. If things play out the pattern could be setting up a cup and handle.
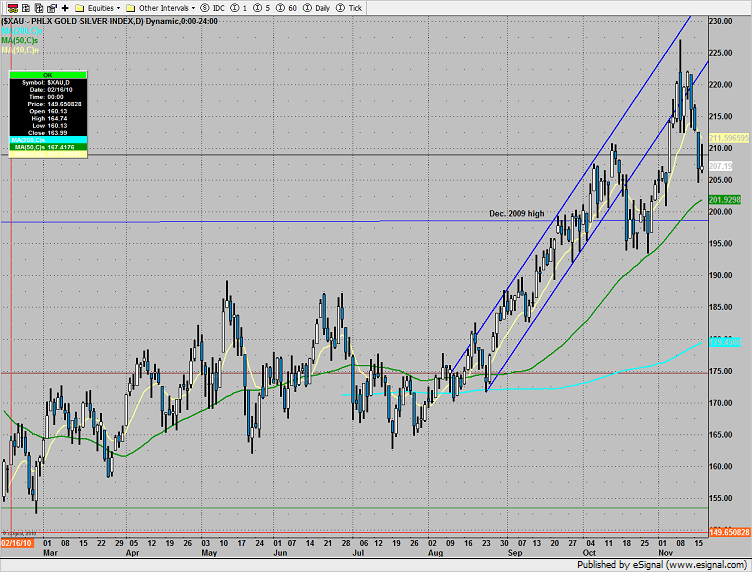
The XAU was little changed, posting an inside candle. The GDX etf closed at $58 which could be the strike peg for expiration and trap price.
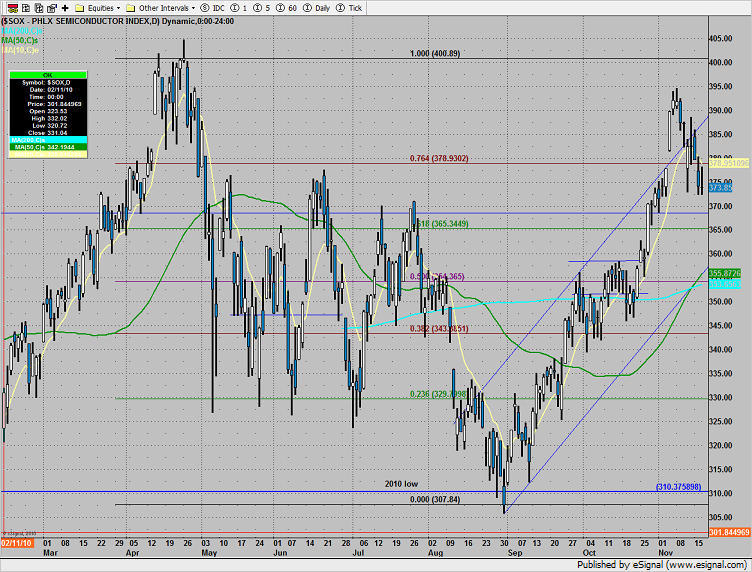
The SOX used yesterday’s low for support. Set an alarm for a break under 372.25 which would be a bearish continuation.
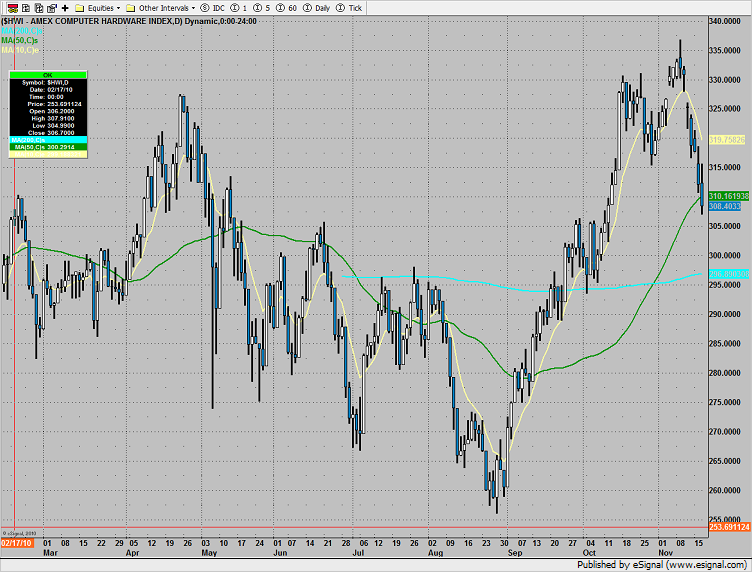
The computer hardware index, the HWI, settled below the 50dma. With the SOX weak, this needs to be watched closely.
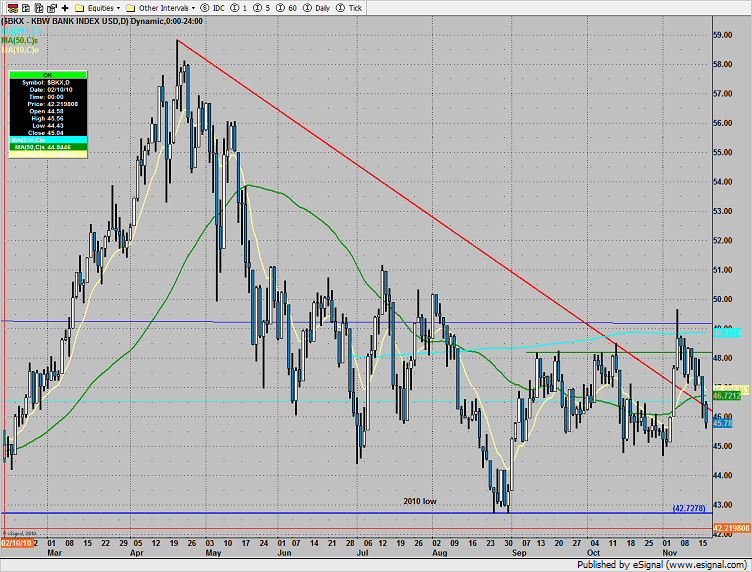
The BKX was the last laggard. Price is back below both the 50 and 200dmas likely just basing.
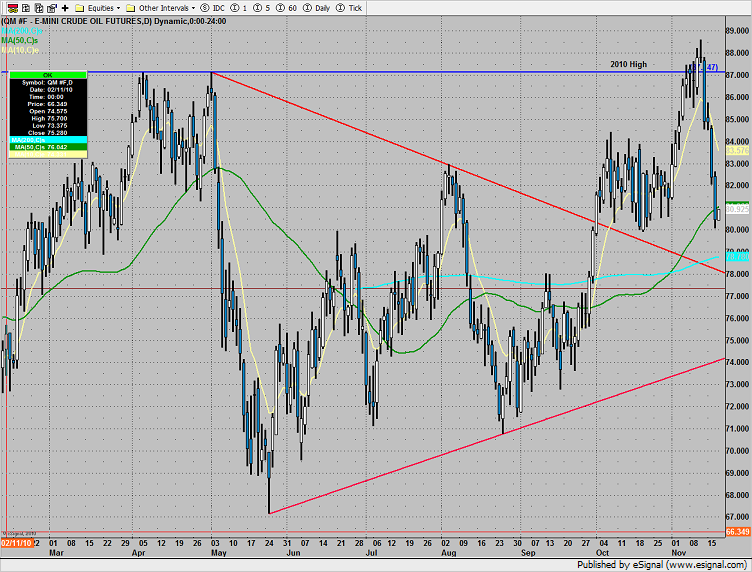
Oil suffered further liquidations. 80 was the low of the prior trading range so look for support there.
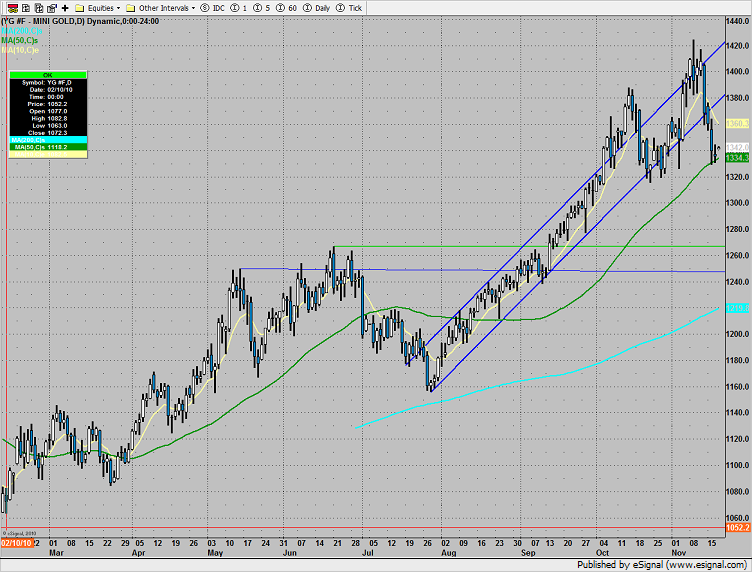
Gold did very little but notably outperformed most other commodities (cotton was limit down). Keep an eye on the key support around 1320 (static trend line).
Market Index Preview for 11/18/10
November 17, 2010
|In Tradesight