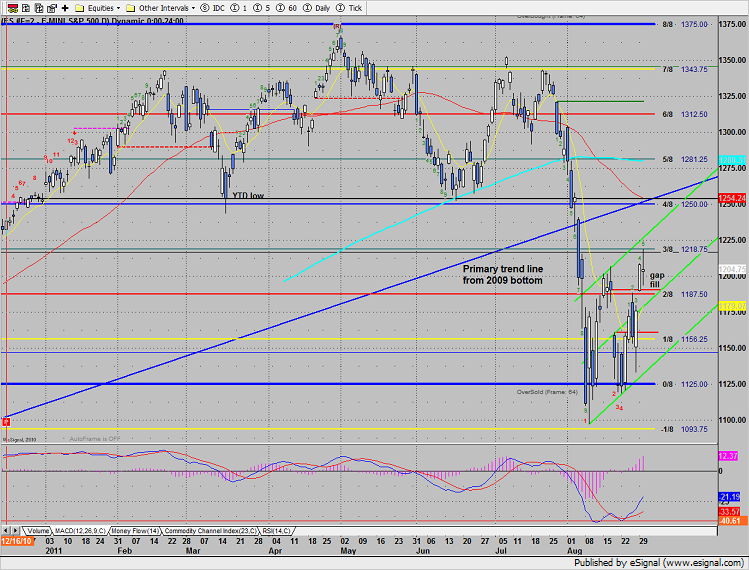
The SP traded a broad range but settled slightly lower on the day. A regression channel has been added to the chart.
The Naz side of the market was actually much more interesting than the SP side. The futures closed up on the day and even tested the 4/8 level. Keep in mind that there are some key moving averages between 2266 and 2283.
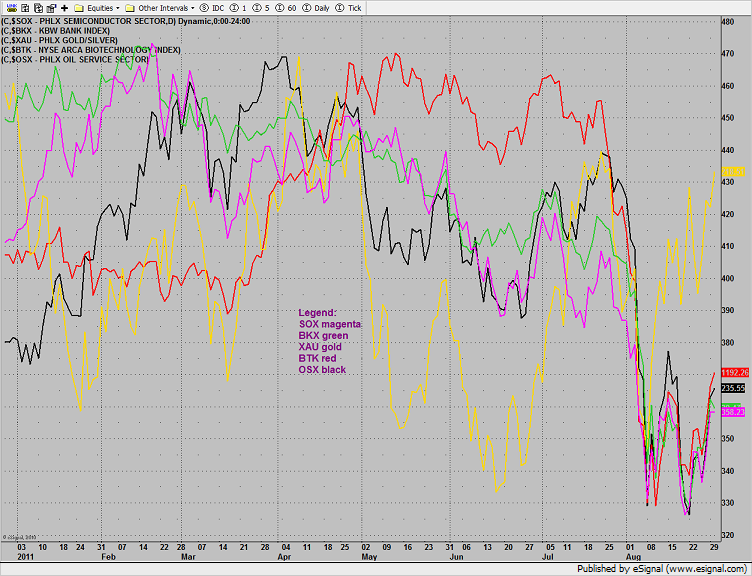
Multi sector daily chart:
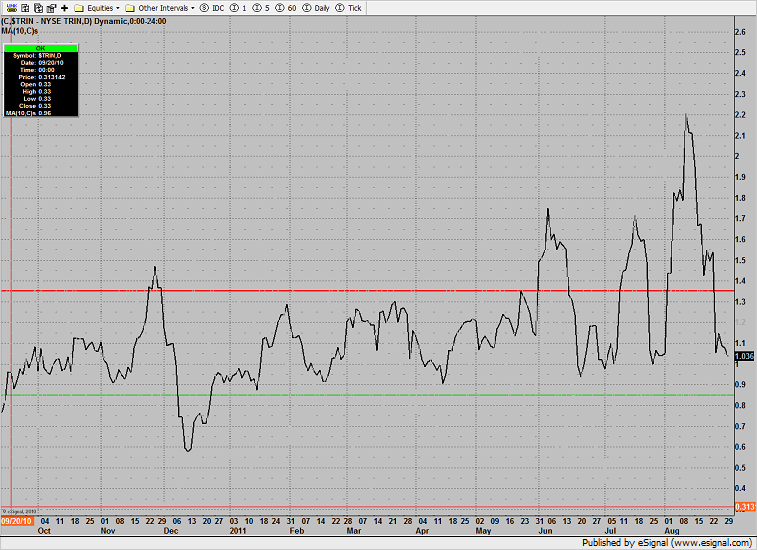
The 10-day Trin has released most of its oversold energy as it nears the 1.0 baseline. There is still more room for it to travel before it gets overbought at 0.85 or less.
The XAU was the top sector on the day making a new high on the move. Next resistance is the 220.80 static trend line.

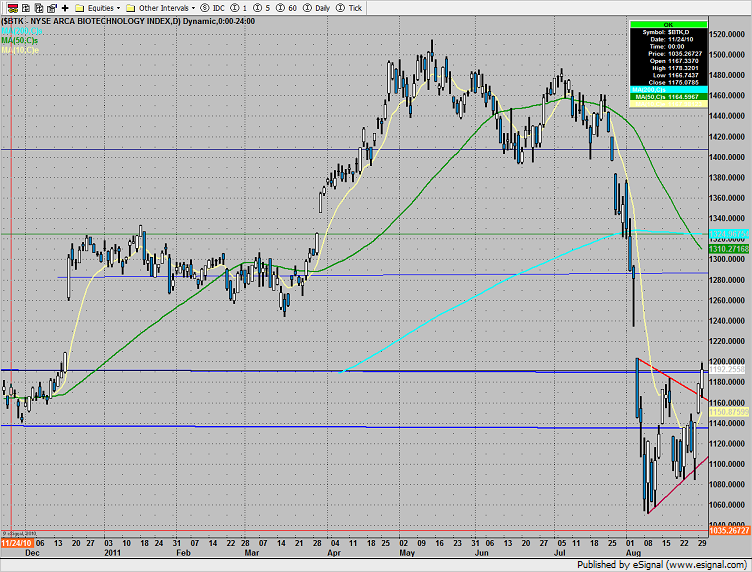
The BTK followed through and is approaching the gap window form early August.
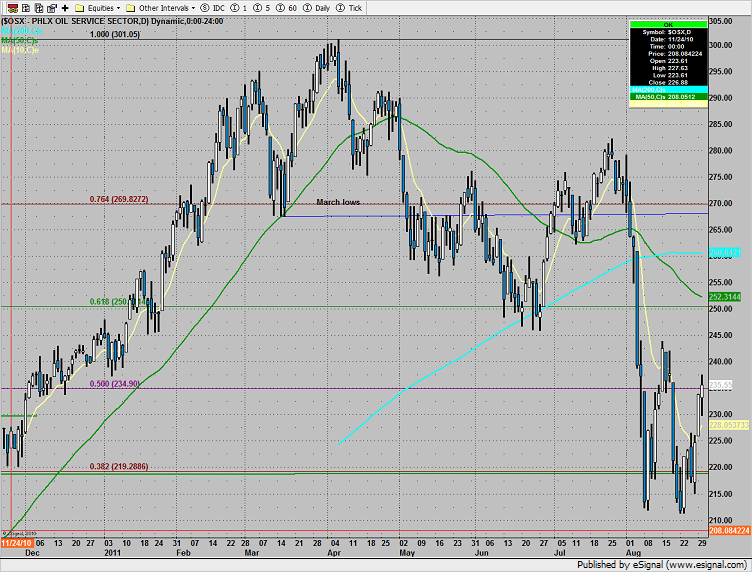
The OSX is still in the same range and had relative strength vs. the broad market today.
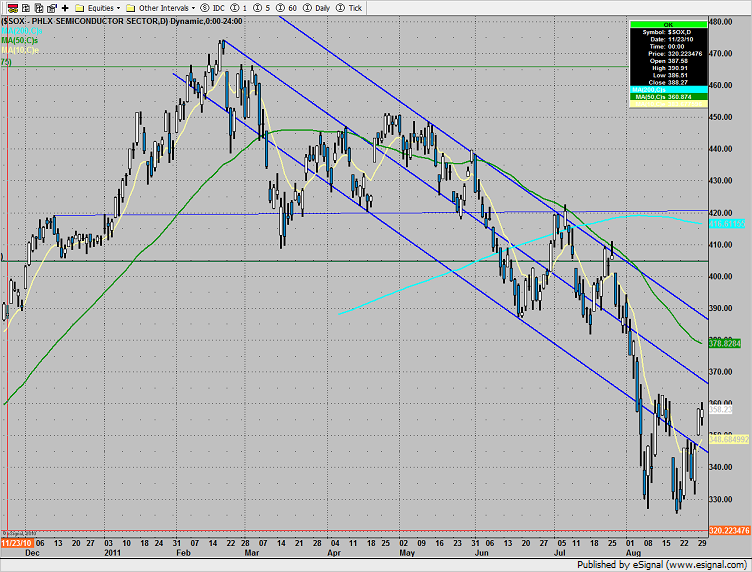
The SOX did very little and lagged the Naz.
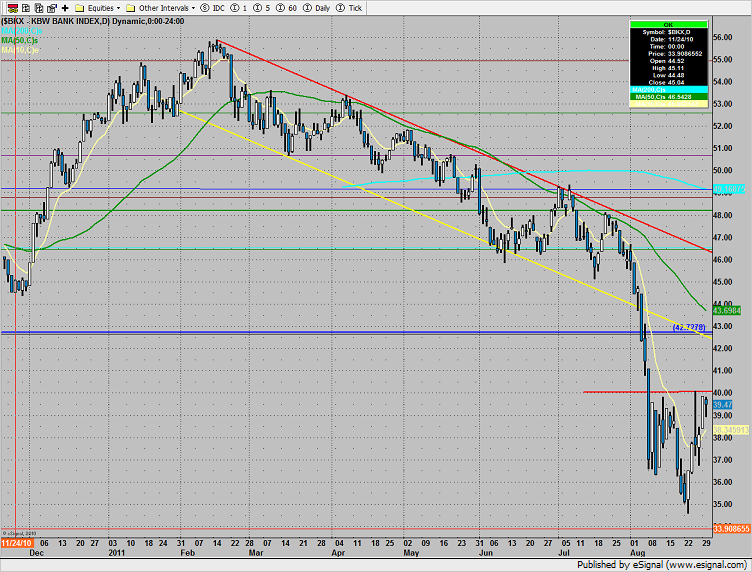
The BKX couldn’t build on yesterday’s gain. The chart is setting a key level at 40.
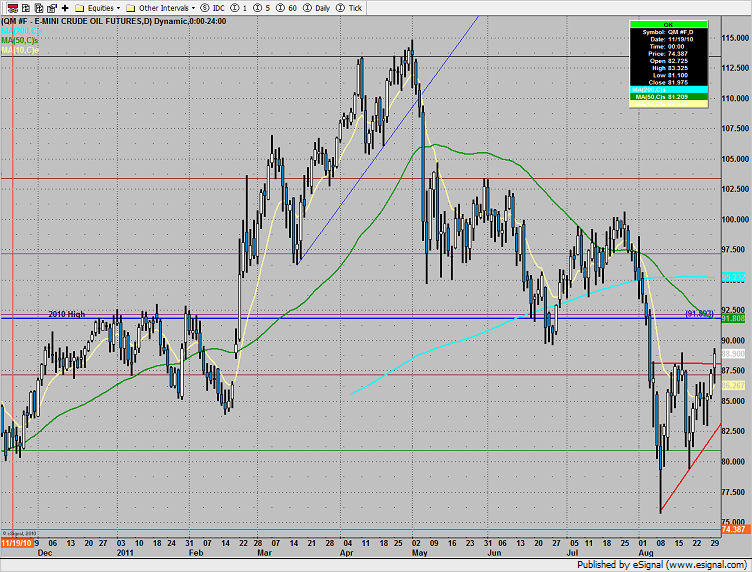
Oil is trying to push out of the pattern. Resistance areas are the 90 breakdown and then the 50dma.
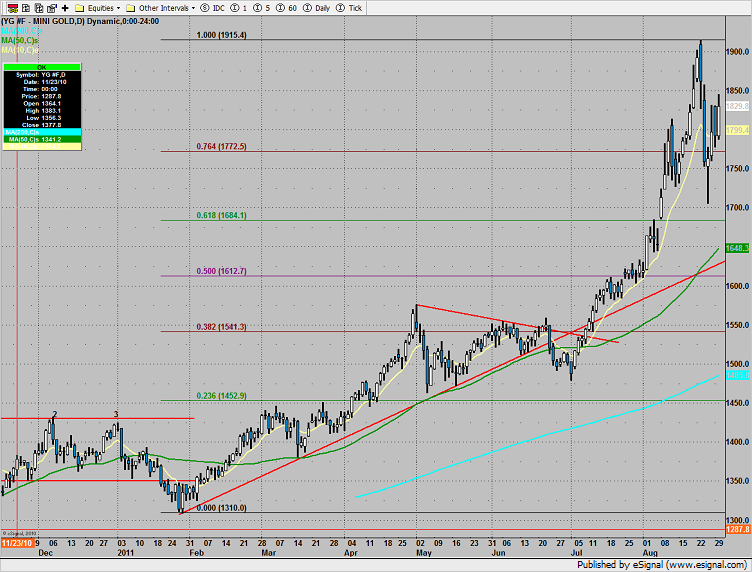
Gold was higher again and if price exceeds 1850 then a full retest of the high is in the cards.
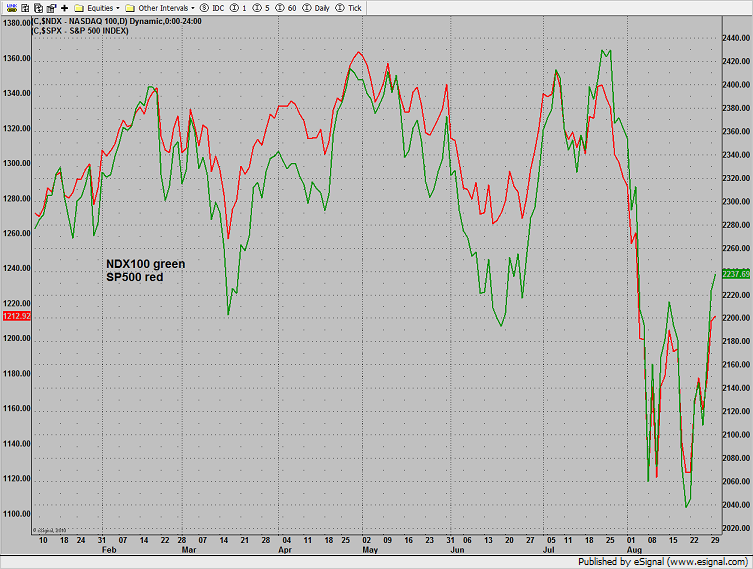
The NDX currently has relative strength vs. the SPX which is bullish for overall equities.
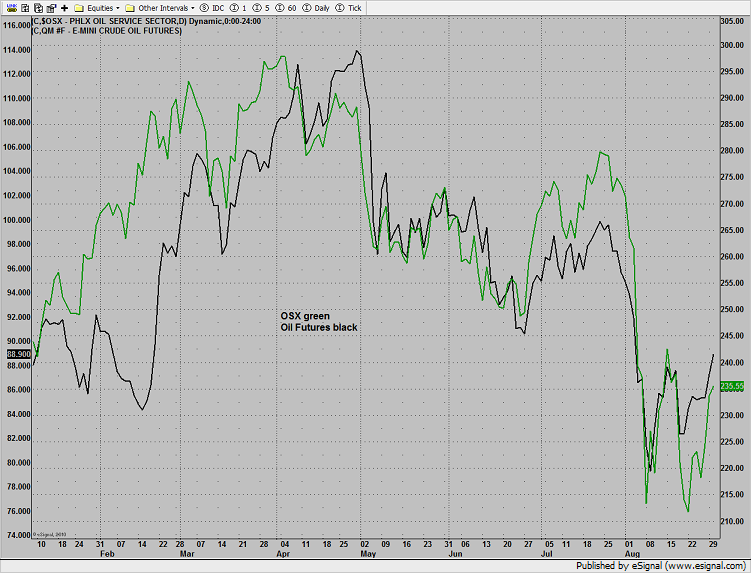
The OSX is now lagging the underlying oil futures which is usually bearish for crude.
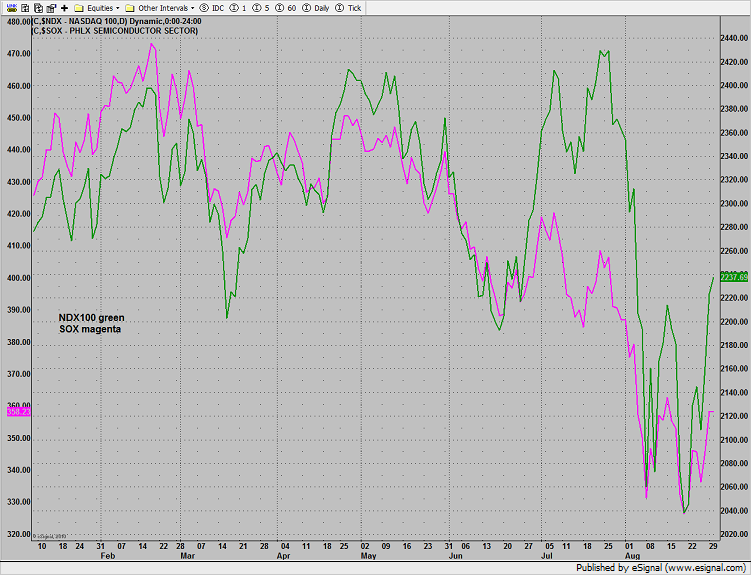
The SOX continues to lag the overall NDX which is generally a bearish condition.
Tradesight Market Preview for 8/31/11
August 30, 2011
|In Tradesight