Something that I’ve come to call a “Comber Wall” is when our Comber tool repeatedly gives sell signals near the same price area on a chart (or buy signals, as the case may be) over the course of several days. This is especially more powerful in cases where there are no signals in the opposite direction in between.
Let’s take the case of NTAP over the last 3 days. I typically focus on a 5-minute chart as it gives you a small enough time frame to work without being impractical.
Here’s the chart of NTAP that I’m referring to:
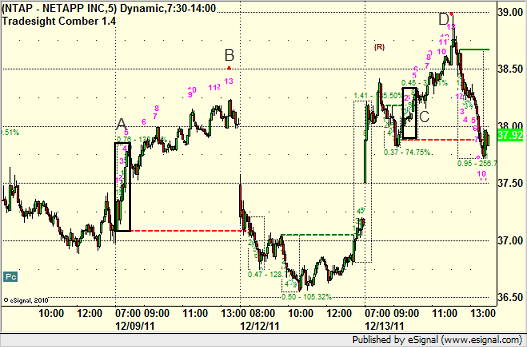
Now, the Comber counts that matter are the pink (or magenta) counts. When you get a 13-signal in pink, you have an ultimate buy or sell signal. In this case, there are two sell signals over the last three days. One was on Friday, in the latter half of the day. The setup phase for the tool was the black box under the letter A. This led to a Comber count and sell signal at B, which clearly was a top as the stock rolled and then gapped down Monday morning and spent the day at lower prices.
Note that on Monday, even though we had a couple of setup counts, we did not have any of the pink Comber counts complete. Then today, on Tuesday, NTAP rallied again. We got back to the price levels from late Friday and formed another setup box to the left of C. This led to a Comber count and sell signal at D, which led to an even sharply roll.
Note that in this case, the stock had returned to a sell-off point from Friday, tried to get higher, and then got the Comber sell signal. This is what I mean by a Comber Wall. It’s a lot of resistance that keeps showing energy sell signals.
The Comber and Seeker tools remain the most powerful tools for trading out there as far as I’m concerned. They work in all asset class (we teach stocks, futures, and forex) and on all timeframes. The ultimate signals are extremely accurate.
The NTAP Comber Wall
December 13, 2011
|In Tradesight