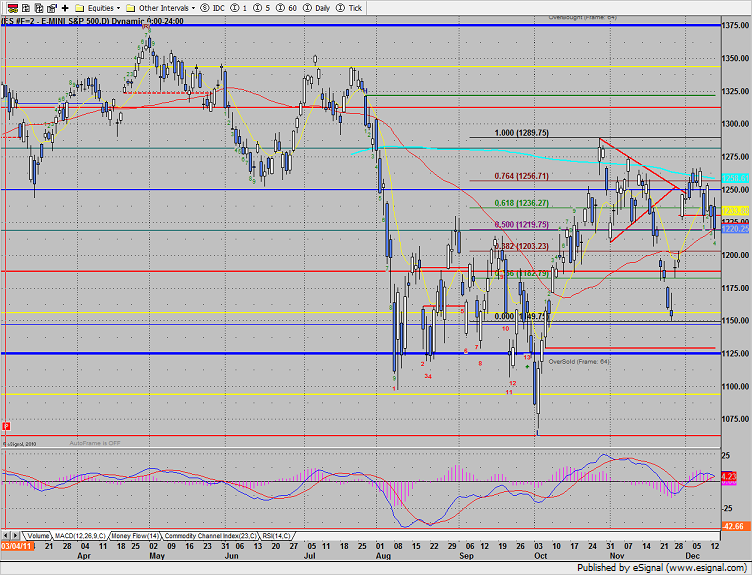
The ES reversed sharply intraday after gapping up and then trading above yesterday’s high. Price settled right at the key 1220 area discussed in the prior report. The current setup favors that the 1200 gap is likely to fill.
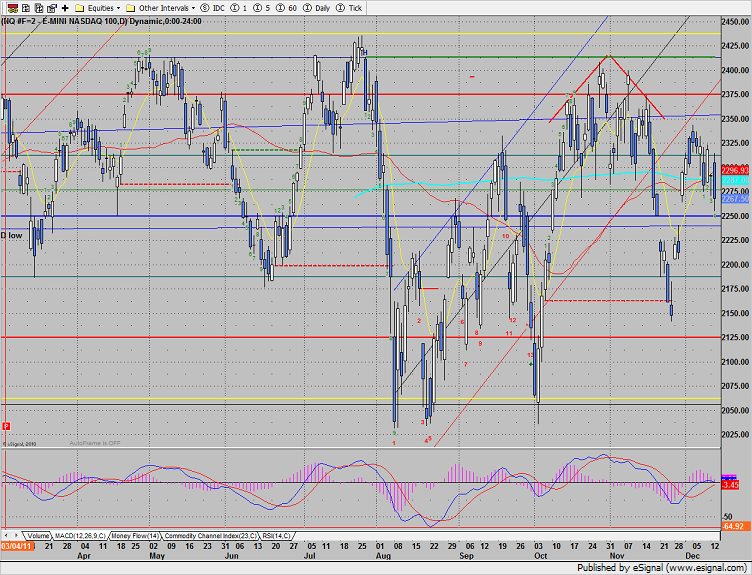
NQ futures were lower by 23 which, at least temporarily, puts price below the 50 and 200dmas. 2250 is a key gap window and doesn’t “fill” until the 2225 area.
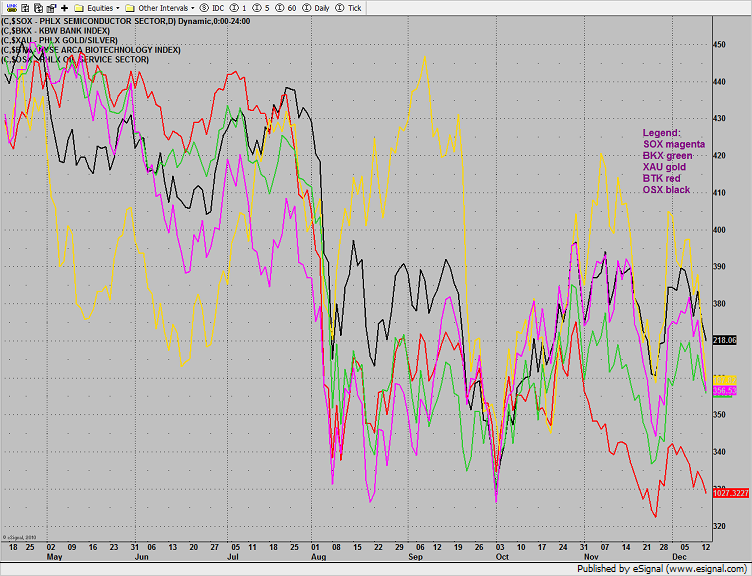
Multi sector daily chart:
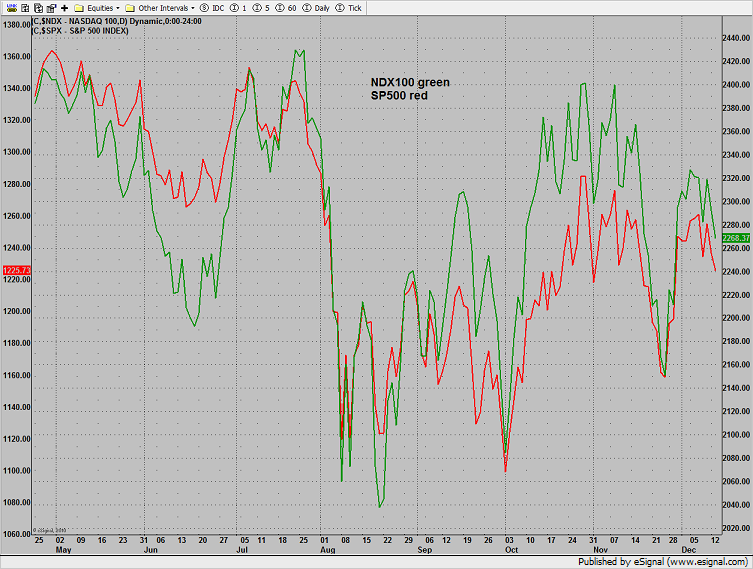
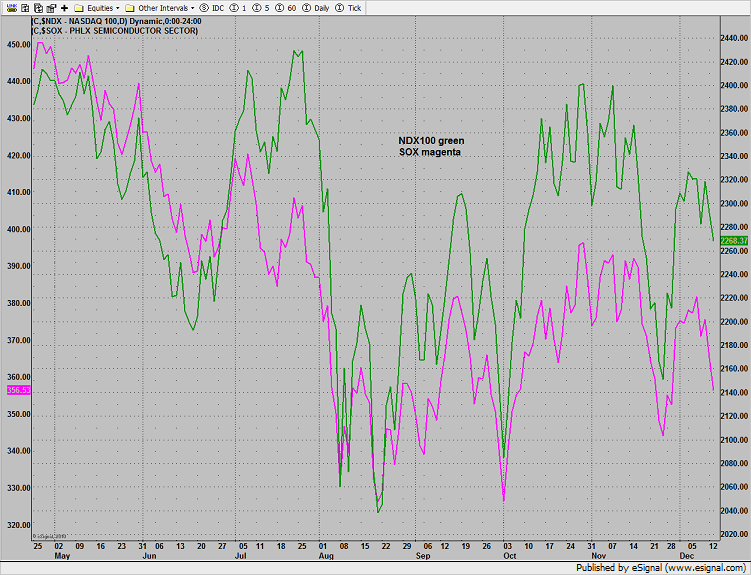
The NDX is moving in tandem with the SPX but still has some positive relative strength remaining. A cross where the NDX becomes weaker than the SPX would be very, very bearish.
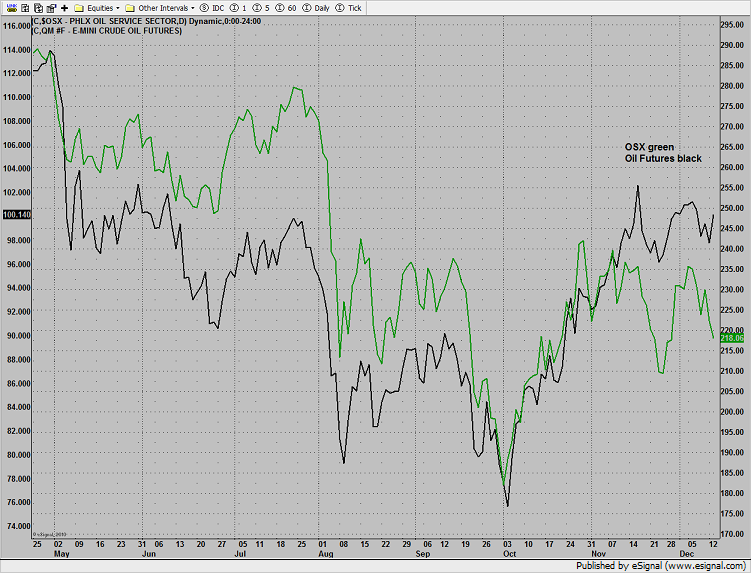
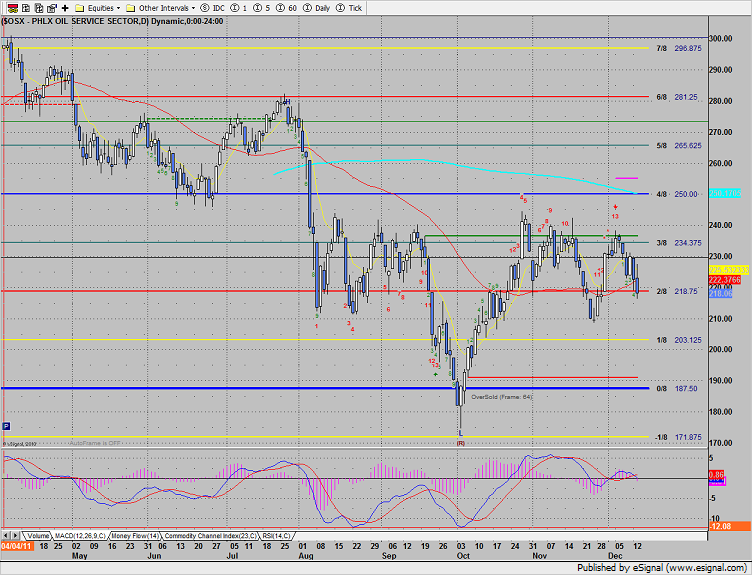
The OSX continues to bearishly lag crude futures. This usually results in negative price action in the futures as they ultimately trend in the direction of the underlying stocks.
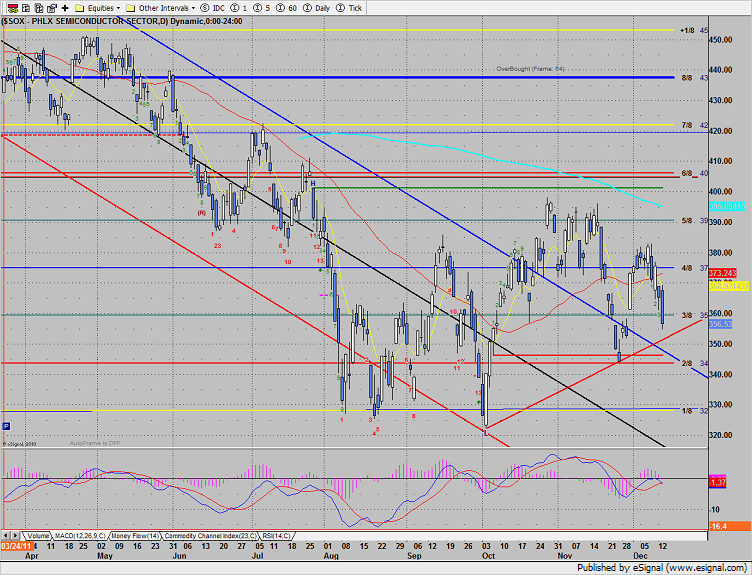
Semiconductors are still bearishly lagging the overall NDX.
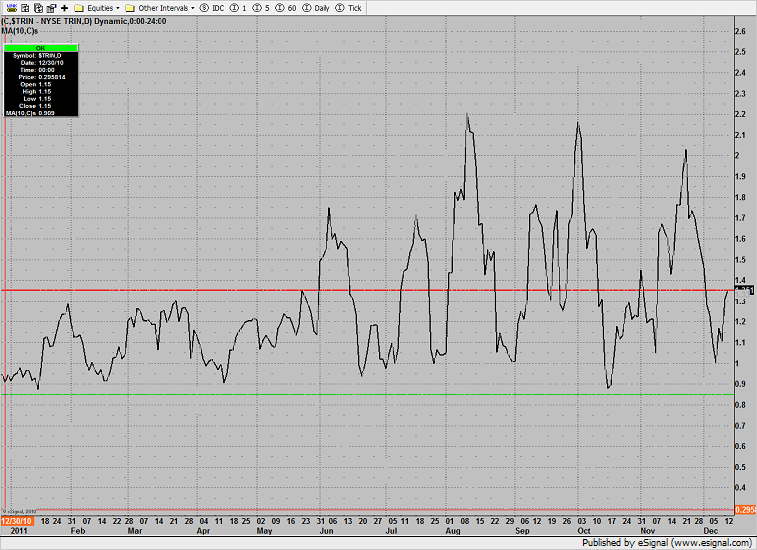
The NYSE 10-day Trin is once again at the 1.35 oversold threshold.
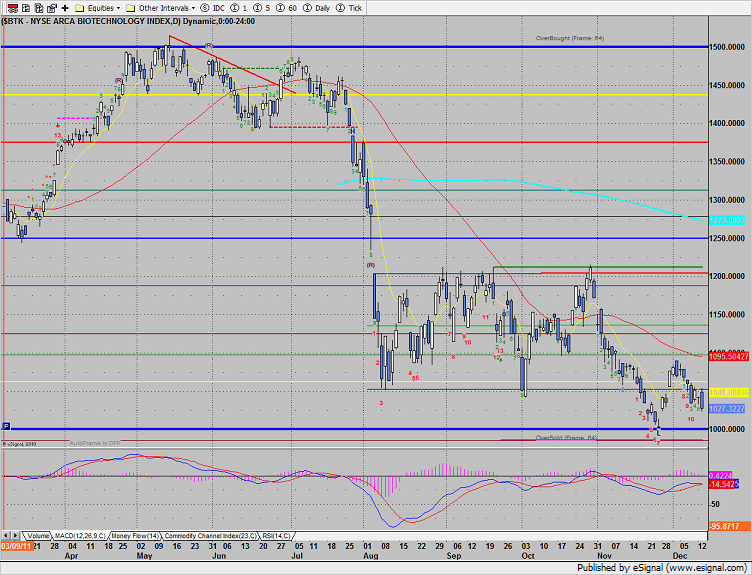
The BTK was the top gun on the day.
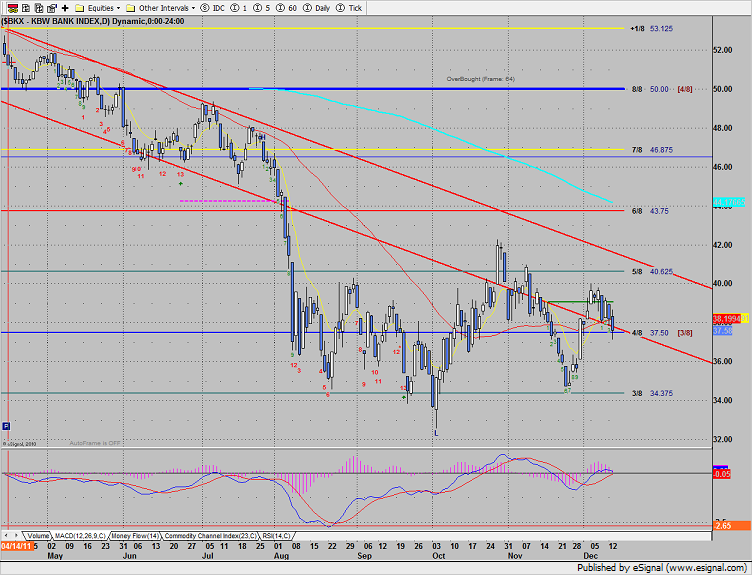
The BKX is now back below all the major moving averages. There is minor support right here at the 37.50 level. There is more important support at 34.37.
The OSX closes below yesterday’s low and was relatively weak even with higher oil prices. Keep in mind that there is a fresh Seeker 13 exhaustion signal in play.
The SOX was awful–much weaker than the Naz or SP. Keep a close eye on the minor up sloping DTL which lines up with the open gap from 11/29.
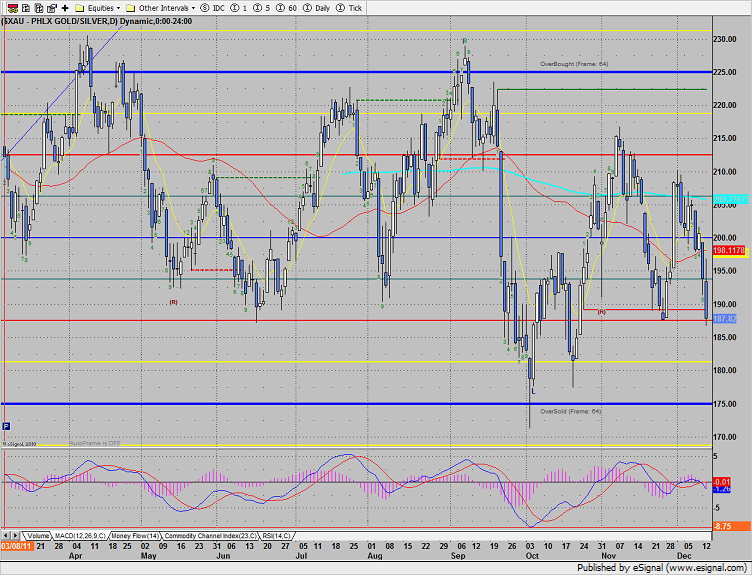
The XAU is picking up speed to the downside and has settled below the active static trend line. Next support is in the 180 area.
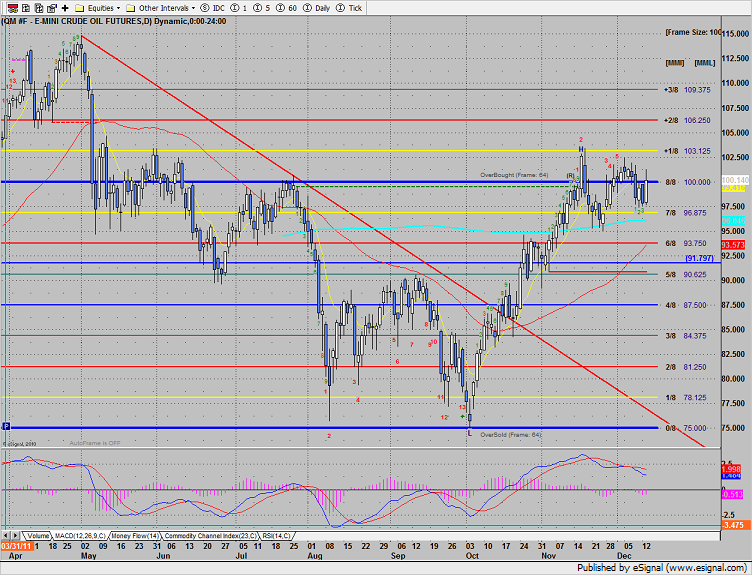
Oil was higher by $2+:
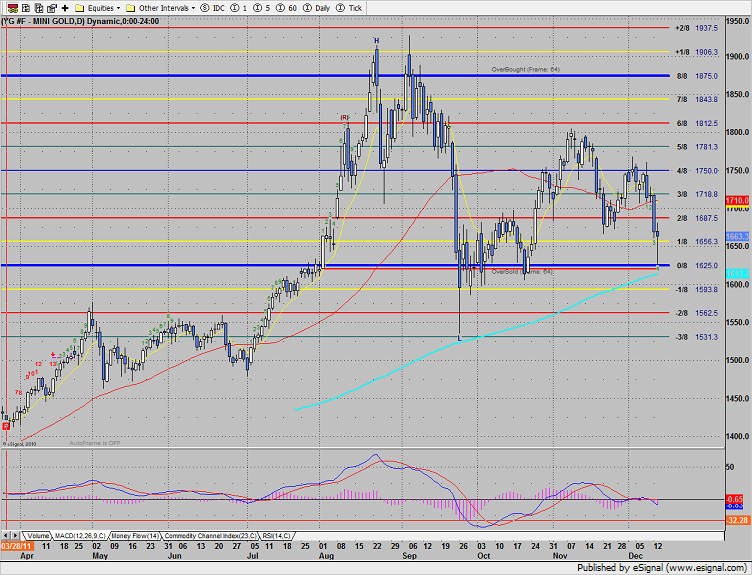
Gold broke very hard and hit the 0/8 Gann level. The Seeker setup is only 4 days down. Set an alarm for a break under the 200dma which could trigger some stops.
Tradesight Market Preview for 12/14/11
December 13, 2011
|In Tradesight
Tradesight Market Preview for 12/14/11
December 13, 2011
|In Tradesight
The ES reversed sharply intraday after gapping up and then trading above yesterday’s high. Price settled right at the key 1220 area discussed in the prior report. The current setup favors that the 1200 gap is likely to fill.
NQ futures were lower by 23 which, at least temporarily, puts price below the 50 and 200dmas. 2250 is a key gap window and doesn’t “fill” until the 2225 area.
Multi sector daily chart:
The NDX is moving in tandem with the SPX but still has some positive relative strength remaining. A cross where the NDX becomes weaker than the SPX would be very, very bearish.
The OSX continues to bearishly lag crude futures. This usually results in negative price action in the futures as they ultimately trend in the direction of the underlying stocks.
Semiconductors are still bearishly lagging the overall NDX.
The NYSE 10-day Trin is once again at the 1.35 oversold threshold.
The BTK was the top gun on the day.
The BKX is now back below all the major moving averages. There is minor support right here at the 37.50 level. There is more important support at 34.37.
The OSX closes below yesterday’s low and was relatively weak even with higher oil prices. Keep in mind that there is a fresh Seeker 13 exhaustion signal in play.
The SOX was awful–much weaker than the Naz or SP. Keep a close eye on the minor up sloping DTL which lines up with the open gap from 11/29.
The XAU is picking up speed to the downside and has settled below the active static trend line. Next support is in the 180 area.
Oil was higher by $2+:
Gold broke very hard and hit the 0/8 Gann level. The Seeker setup is only 4 days down. Set an alarm for a break under the 200dma which could trigger some stops.