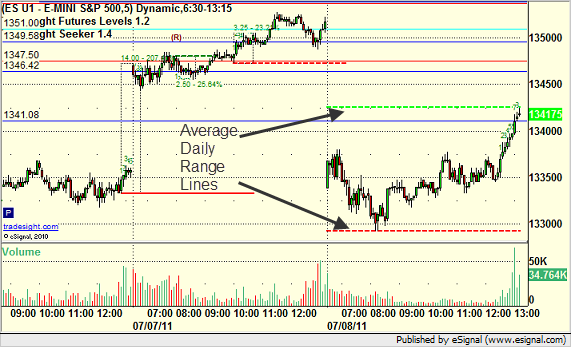
Let’s talk about island reversal formations. The concept is that the market is heading one direction (we will use up in this example); INSERT INTO `wp_posts` (`ID`, `post_author`, `post_date`, `post_date_gmt`, `post_content`, `post_title`, `post_category`, `post_excerpt`, `post_status`, `comment_status`, `ping_status`, `post_password`, `post_name`, `to_ping`, `pinged`, `post_modified`, `post_modified_gmt`, `post_content_filtered`, `post_parent`, `guid`, `menu_order`, `post_type`, `post_mime_type`, `comment_count`) VALUES then gaps UP further one day and holds, then gaps down ENTIRELY below the range of that day the next and never trades into the range of that prior day. This leaves you with a floating island on the daily chart. A break under the lows of that pattern is then a short trigger. ES with Tradesight Levels:
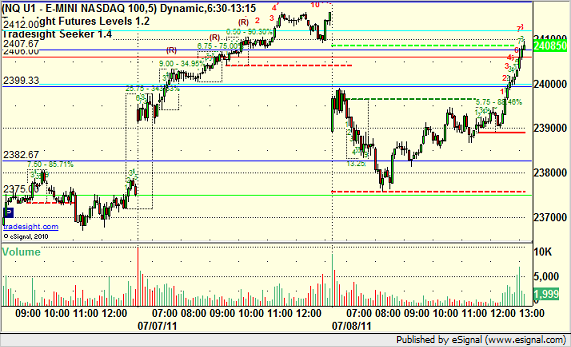
NQ with Tradesight Levels:
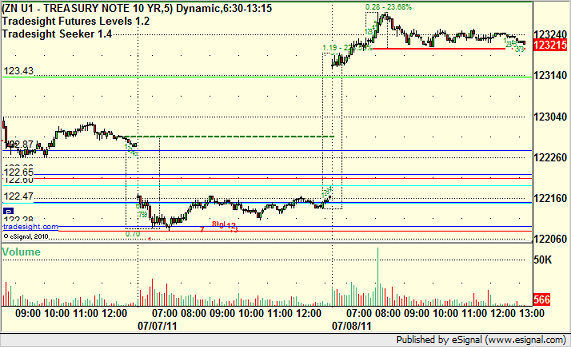
ZN (10-year Treasury Note) with Tradesight Levels:
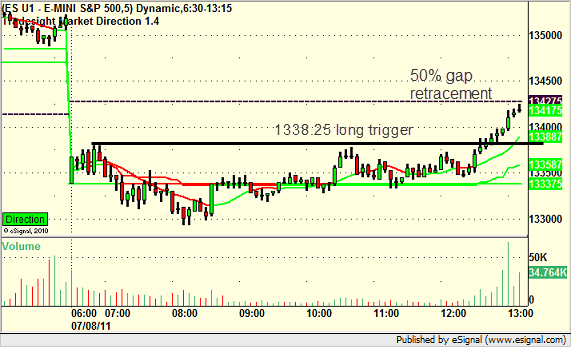
ES with Tradesight Market Directional Tool:
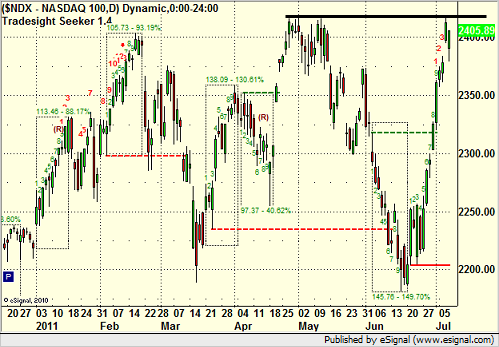
So what does that island formation discussion above mean for the daily charts? A few things to consider. First, the NDX recovered enough Friday that there is no island there, and it looks ripe for a breakout:
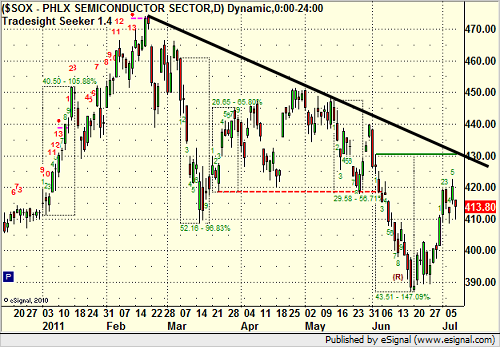
The SOX is the major index that is lagging the tech sector here (software and biotechs are much stronger):
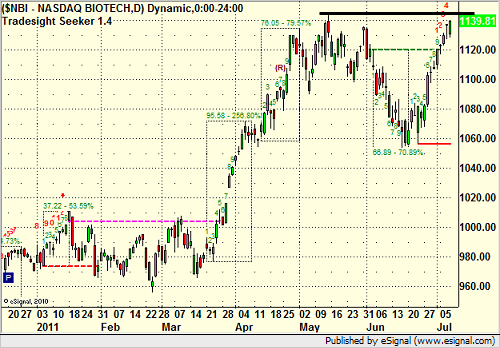
The biotechs are breaking out:
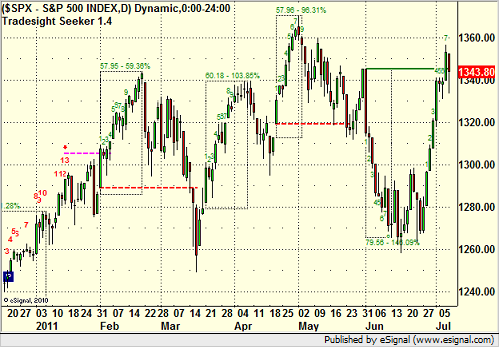
The S&P looks strong too, but you can’t see the gap on the S&P chart the way that open and closing action works to not show gaps:
Most of this is very bullish action that looks good for a breakout, and certainly if the NDX takes out the highs, that could lead to a run (that would be the trigger.
However, let’s remember that in any real sense, there is an island on the S&P, which you can see in the chart of the SPY:
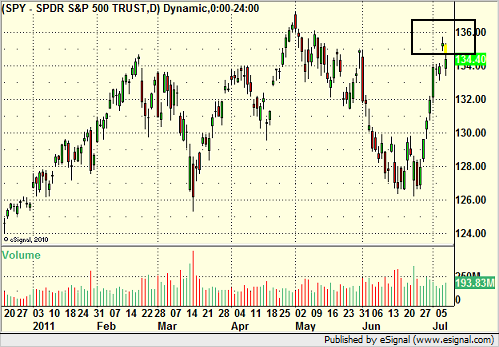
That is an extremely negative topping pattern when it confirms, and the confirmation, as I stated in the section above, would be a trade through the low of Friday. So, NDX making new highs, major buy signal. S&P under Friday’s lows…maybe even a more powerful sell signal.
Market Preview for 7/11/11
July 8, 2011
|In Tradesight