Coming into the week on Sunday, we posted a swing trade idea (meaning a trigger with a stop that is meant to be held over time if needed, not just daytraded). The call was a long on GOOG, and you can read the original posting that we Tweeted and sent out via the Blog. The posting can still be read here as it was posted Sunday night.
When you enter a trade from a daily chart, looking for a multiple day “swing,” you can’t just use a 5-minute chart to determine how you will manage the trade. You need something wider, such as the 15-minute chart. Let’s take a look at how the GOOG trade worked. The exact call was to buy it over $625.91 with a stop loss if it closed under $625 on a closing 15-minute bar basis. The target was the daily chart gap fill at $639.57.
Here’s the 15-minute chart, with the trigger line where the trade was entered on Monday:
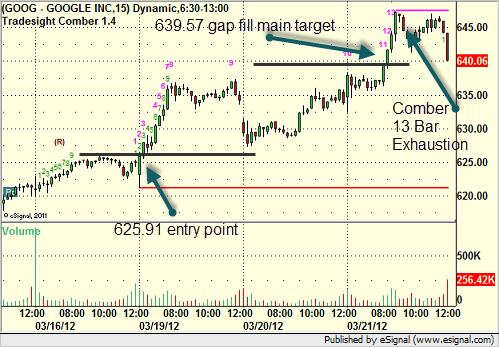
Now, there are several important points on the chart. First, the trigger was clean and easy, no gaps at the time, just a clean move through the price. Second, the stock clearly never went back under $625 to stop out. Third, if you held it over the next three days (or at least part of Wednesday), it easily hit the target of the gap fill at $639.57 for almost a $14 winner, but then proceeded higher, and the HIGH BAR OF THE MOVE was the 13-bar sell signal using our Comber tool, which should have been a final exit. Note that that bar is the top for the week so far, and as we say at Tradesight, on to the next trade. What happens next doesn’t matter to us, but we had a clean trigger, no risk against the price, met our first target and final target both established in advance, and had a tool that gave you the ultimate sell.
GOOG Trade Call Summary
March 21, 2012
|In Tradesight