Time to analyze the US Dollar Index, as we are getting to a “make or break” point here conceptually. While the chart certainly looks weak overall, it is important to recognize that from an energy perspective, it is sitting right on a static trendline (red line) of the last 9-bar move up, which could be support as these often serve as trade targets:
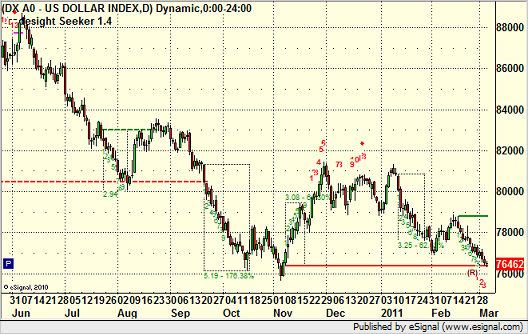
If that breaks, it isn’t far to the lows of the year, and if that breaks, look out. Meanwhile, let’s review what this means to our GBPUSD wave analysis conversation from last week, which you can read here. Here’s the updated daily chart:
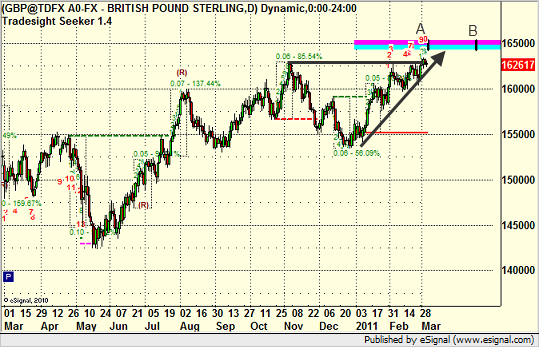
The comment we made was that even though a breakout looked like it could be pending, the MoB line (blue and pink) target represents the likely goal of the move, and typically, you would expect to get it between the black lines at A and B.
Notice that because it took its time, the GBPUSD is now on a path to hit the MoB between the black lines, right on target. This suggests that, at least in the short term, the US Dollar Index will break lower.
GBPUSD Target Update and US Dollar Index Analysis...
March 4, 2011
|In Tradesight