Let’s discuss the broader view of the US Dollar Index. Let’s start with a fairly short-term look at the daily chart, which broke down over the last two weeks:
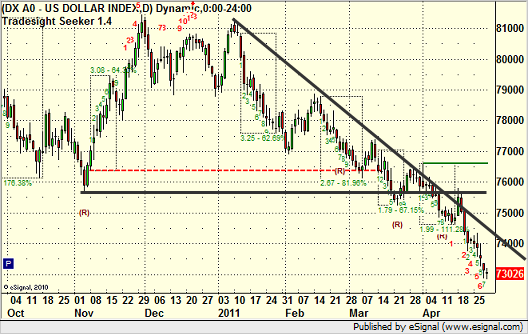
That chart shows a clear downtrend in place, with a trendline that we can follow easily. Also, Friday’s close would be 8 bars down on a new Seeker count. The 9th bar is typically where we start to see exhaustion.
The goal here is to measure the exhaustion from multiple timeframes and see what it gives us.
If you back the daily chart out a bit, you can see the inverted cup and handle over the last year or more that broke down, which is a significant technical break:
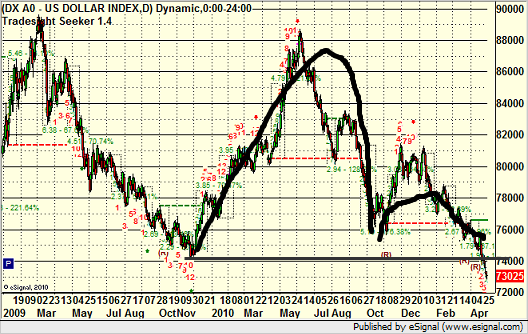
More importantly, however, we will back the chart out to a weekly chart, which shows more of the chart going back in time as we approach the true lows for the US Dollar Index. The key here is that we are within striking distance of the all-time lows, but also, with Projection Mode on with the Seeker tool, you can see that this week that just ended also gave us the 12th bar of the actual Seeker count (not the 9-bar setup count). A 13 would be a strong reversal buy signal on a longer-term timeframe, and if we were able to dip down and hit the prior lows in the process, that would be a double bottom, which would be interesting.
Even more interesting, take a look at the monthly chart. Here, you can see almost 2 decades of data, with the highs back in 2000-2001, and the low in 2008. But the Seeker setup count on the monthly is now 8 bars down, meaning that April could give us a 9 and be a short term energy flip:
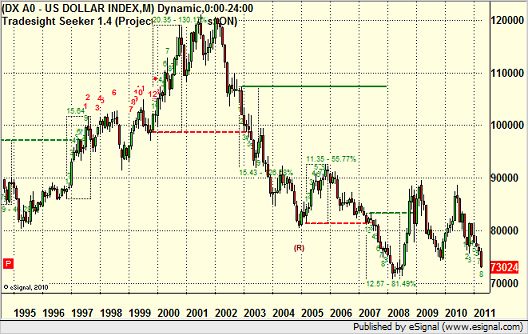
In all timeframes, the US Dollar is heading toward significant reversal signals as it approaches the prior lows. The bounce could be interesting.
Current View of the US Dollar Index
April 29, 2011
|In Tradesight