We’re currently tracking a key breakout in the daily chart of the AUDUSD over the 0.9406 level. There is a general inverted head and shoulders formation over six months forming here, which creates a lot of strength as the pair winds up for the breakout:
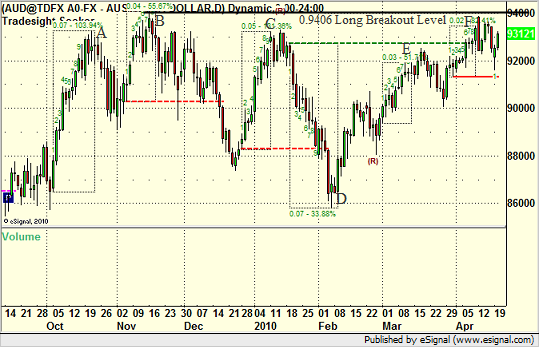
It is important to note that there is no trade until the breakout occurs. However, one key feature is our 9-bar counting indicator. On the chart, the bar counting method draws a dashed box around each count setup. The tool is generally designed to look for energy reversal points in the market. There are six boxes on the chart as shown.
Let’s analyze what is occurring, starting with the first box to the left. This is a big box that terminated at point A on the chart and led to a reversal right from that point. The next box was a later turn up that stalled out at B, also a key turning point, and that created the breakout level that we are monitoring now.
Over a month later, we had another upward count that terminated at C and caused a downside reversal again in the pair. We then had the biggest setup count in the last six months to the downside, ending at point D on the chart. That’s the biggest energy move, and the buy signal formed at the end of the box ends up being the low since then AND the head of the inverted head and shoulders.
What is the most interesting is that the second half of the pattern should be where strength really starts to build up, and the tool helps us spot that as well. Note that the counts that end at box E and F did not really lead to downside reversals on the AUDUSD. In other words, the AUDUSD is shaking off overbought energy as it heads toward the breakout of this pattern. That is a very critical component of the move and the setup. More details to come as the pattern plays out.
AUDUSD Breakout Looming?
April 20, 2010
|In Tradesight