One thing that you rarely see in a Forex pair or the US Dollar Index is a gap. In fact, the only practical place where a gap could occur is between the Friday close and Sunday open.
What we do know from other markets is that from a technical perspective, the following are true:
80% of gaps fill the same day
95% of gaps fill within a week
99.5% of gaps fill eventually
Also, we know that when it comes to long-term trendlines, once they are well-established, if they break, they flip from support to resistance or vice versa on a retest.
At the moment, due to a rare gap in the Forex market from Sunday, April 11, we have a strange situation that combines the two concepts. Here’s the daily chart of the US Dollar Index with a key trendline that had been critical support for some time:
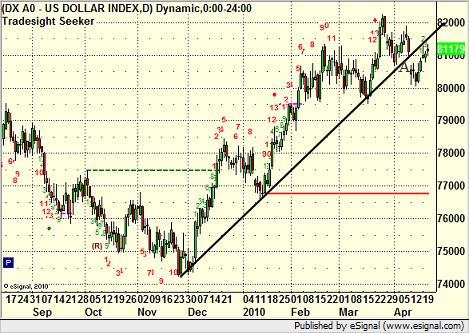
You can see the clear gap down under the trendline at point A. Now, trendlines are considered broken when they break due to price movement, not gaps. In this case, the market gapped down and over the course of the next week or so headed up to fill the gap. So we have met the 95% rule of filling the gap within about a week. However, this now leaves us using the trendline as resistance very clearly instead of support even though the line was not traded through on the downside. Some would call that a conundrum, and while it is extremely unusual and unique in the Forex market, it’s probably worth noting how we play out over the next few days and which concept wins (gap fill or getting back above the trendline as it should still be support).
To learn more about Tradesight’s market outlook, take a free trial here.
A Unique Situation on the US Dollar Index
April 21, 2010
|In Tradesight