We had an interesting set of events last week on the USDJPY. Both our Seeker and Comber tools, which use different techniques to give exhaustion signals after large moves, but gave separate 13 bar sell signals on the daily chart of the USDJPY…at the same time! This is extremely rare for this to happen and add to the power of the potential reversal. Let’s take a look at the two tools separately and then discuss how the USDJPY has reacted so far.
First, we have our Seeker tool, which gives a reversal sell signal with a red “13” above a bar. It also draws a pink risk line, which is then used as a stop out point for the short if we close above it. If the pair closes above it, the pink line becomes dashed instead of solid to show that it is broken. We commonly see a signal and then the use of the risk level as strong resistance, which is exactly what we see here:
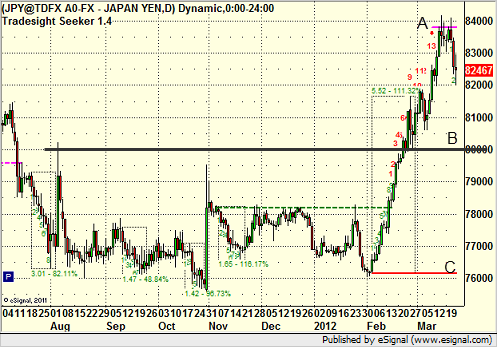
So far, the risk level has not broken, and the USDJPY is starting to roll.
Even though the Comber counts exhaustion differently, in this case, it got the exact same signal, which means the exact same risk level, so even though the numeric count that gets to 13 is different than the Comber, the sell signal and risk level look the same:
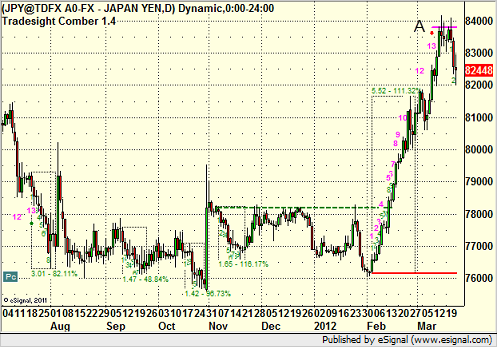
When these two signals line up at the same time, or even one or two bars apart, it creates an even more probably reversal point.
At this point, the USDJPY is just starting to rollover and has established the first 2 bars of a green “setup” count to the downside, which we will monitor to see if it can approach the key 9th bar. At the same time, two targets are in motion. One is the 50% retracement of the move, which is the black line at B. The second, which should not be discounted although it looks extreme now, is the red line C, which is the static trendline of the count itself. Let’s watch for both in the coming days and weeks.
An Outlook on the USDJPY: Dual Exhaustion Signals
March 23, 2012
|In Tradesight