The VWAP (Volume Weighted Average Price) is a powerful tool for traders, but you have to understand the implications of what it means to completely grasp it’s use. In the weeks ahead, we will be focusing several articles on the VWAP and how it can be a useful tool in a variety of ways.
If you don’t know, the VWAP ends up operating like a moving average, but it does so by weighting the price and size of each trade.
So for example, let’s say that we have three prices: 40, 41, and 42. An average of those three would be calculated by adding them up and dividing by 3. That would give you (40 + 41 + 42 = 123) / 3 = 41. A moving average keeps adding data in the form of price and dividing equally by the number of data points.
A VWAP, on the other hand, takes two pieces of information for each price into account before doing the math. It takes the price AND the number of shares for that print. So, now let’s say that we have three data points, which is 100 shares traded at 40, 200 shares traded at 41, and 900 shares traded at 42. Note that this is the same 3 prices that we had when calculating the average price example, but now we have size to go with each. What the VWAP does is take each price times size and divide by the total size.
So, we get:
40 x 100 = 4,000
41 x 200 = 8,200
42 x 900 = 37,800
Add those totals up (50,000) and divide by the total number of shares (1200) and you get 41.67, the VWAP. See how the number is far more skewed toward 42, which is where the much bigger print occurred?
So, what do we do with this?
Institutional traders would prefer to buy below the VWAP and sell above the VWAP. Why? Because it means that they got a better price buying or selling their big block of stock for the day than the average trader. A lot of times, that means that if a stock has been moving down and reverses to the upside, it will stall out right at the VWAP. Who wants to be the guy paying more than the average of everyone else? Of course, at some point, someone often does, but that in itself is confirmation that the dynamics of the stock have shifted for the session.
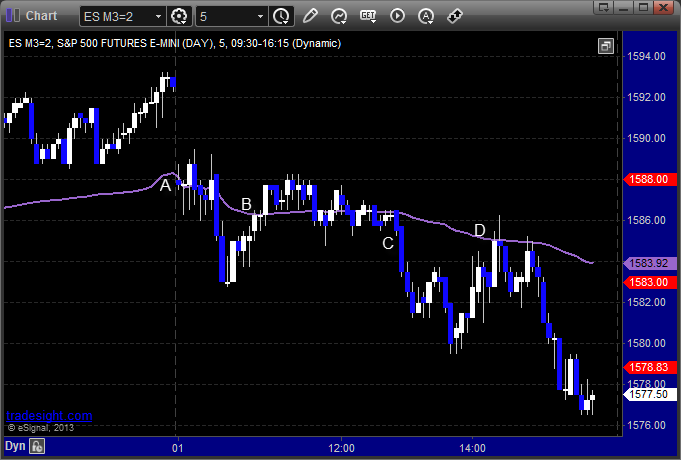
So, let’s take a look at today’s (Wednesday, May 1, 2013) action in the ES (S&P e-mini futures):

We gapped down for the session at A. The purple line is the VWAP of the day as we go along, starting with the open. Note that we opened right where the VWAP had been at the close of the prior session (even though the price late in the day had been much higher).
The market trades flat for the first 30-40 minutes and finally breaks lower on a pair of bad economic numbers. It doesn’t go far on the data, and in fact, after just 15 minutes, seems to be stalling. Keep in mind that this is an FOMC announcement day, which usually means that the market is slow early. So as the small move down fails and the market starts to head up, the ES comes back to the VWAP at B. It then gets blue to the VWAP for hours, really not leaving it either way.
Over lunch, the market starts to drop at C ahead of the Fed announcement. The sellers are banking on something pushing the market lower, and this time the move is bigger. The announcement comes out, and nothing surprisingly negative is in it. Those that were selling ahead of the announcement start to buy back, and it takes the ES once again back to the VWAP at D. Note that this time, the ES uses the VWAP very precisely as resistance and can’t close above it on two attempts. No one wants to pay over that price, and there is nothing compelling to make them.
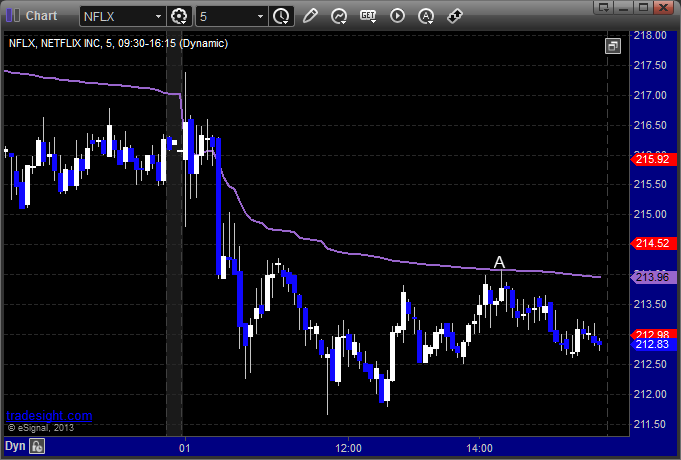
Do individual stocks care about the VWAP? Sure, let’s take one of the current market trading favorites, NFLX. This stock sold off sharply today in the morning and spent most of the morning down quite a bit. As it starts to rise after the Fed, does any big trader want to be the first to pay over the VWAP? Let’s have a look:

Clearly not.
The VWAP has many terrific uses, but these two charts alone give you a starting point about its validity.
