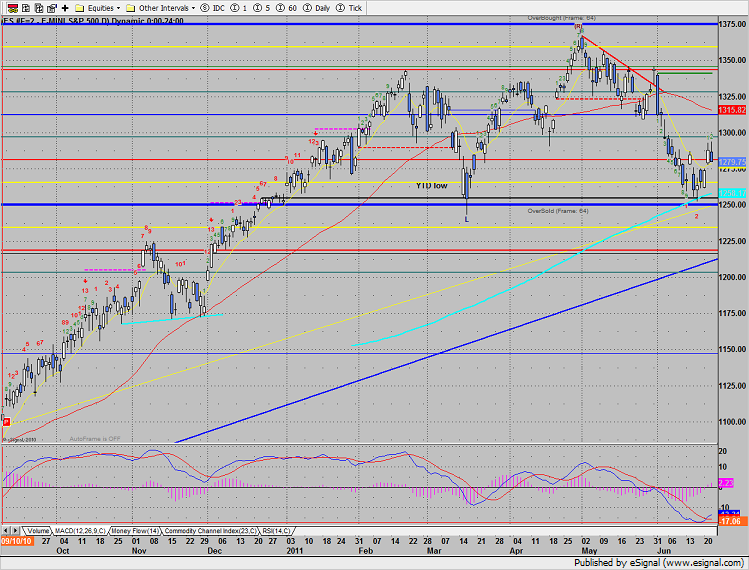
The SP posted a very sloppy day on the chart, losing 8 on the day and closing at the dead low. Late in the day, after Fed chairman Bernake signaled that there will be no QE3, bids evaporated and enthusiasm left town. The technicals remain unchanged though the bulls didn’t put up a fight to register a measuring day to build on. Instead the chart now has a compromising midrange king and queen pattern on the chart which implies a break under Tuesday’s low would turn the pattern back to short-term negative (a loss of the 10ema). Keep in mind that the MACD still has a positive cross and the CCI has yet to get overbought.
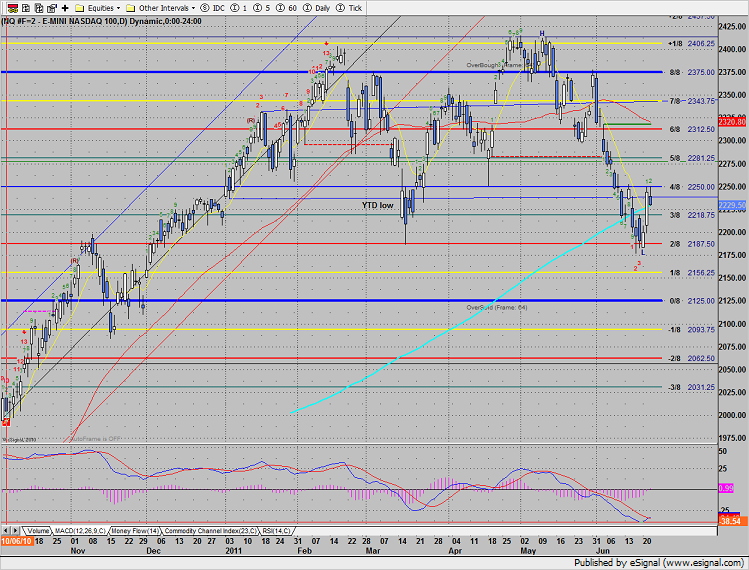
On a relative basis, the Naz was considerably stronger than the SP. Compared to the SP the Naz put in a measuring day where price held above the midpoint of the prior day’s range. Both the Naz and the SP settled right at the 10ema. 2250 is the next hurdle for the bulls.
Multi sector daily chart:
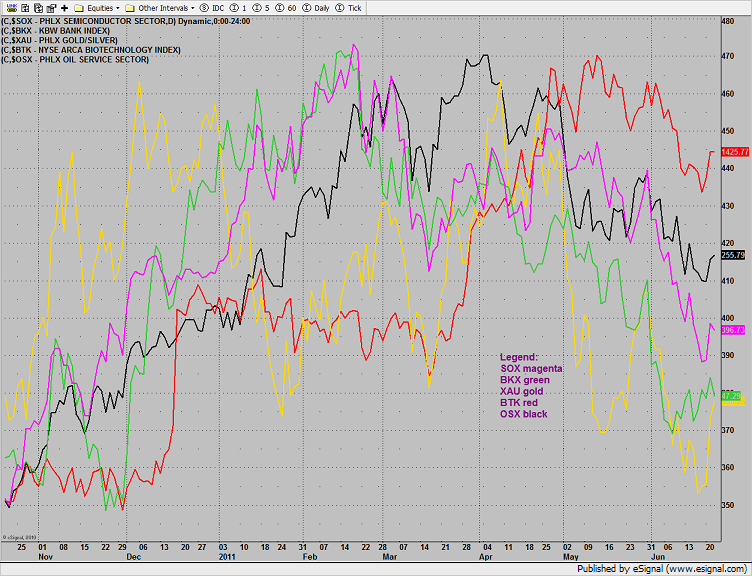
The XAU was top gun taking a shot at the 4/8 level. There is still a considerable amount of upside room for more of a bounce before overhead begins with the declining 50dma.
The OSX was green and recorded the second day up in the Seeker sell setup. Price remains below the active DTL.
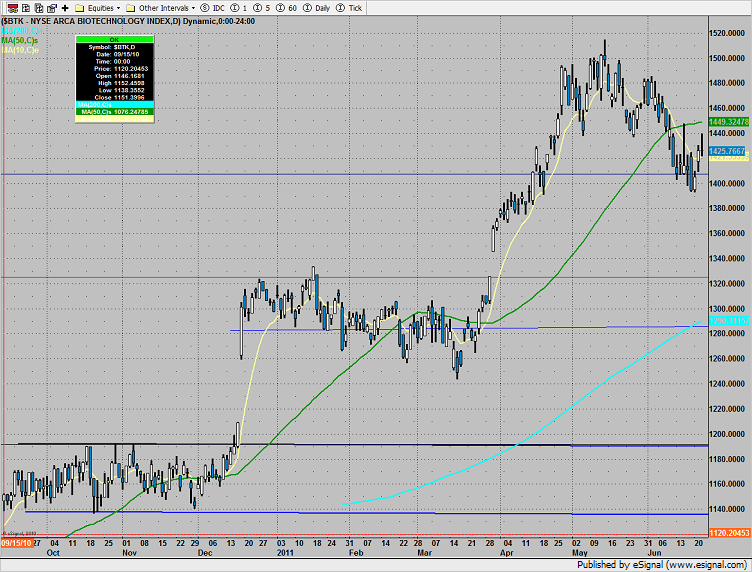
The BTK was about unchanged.
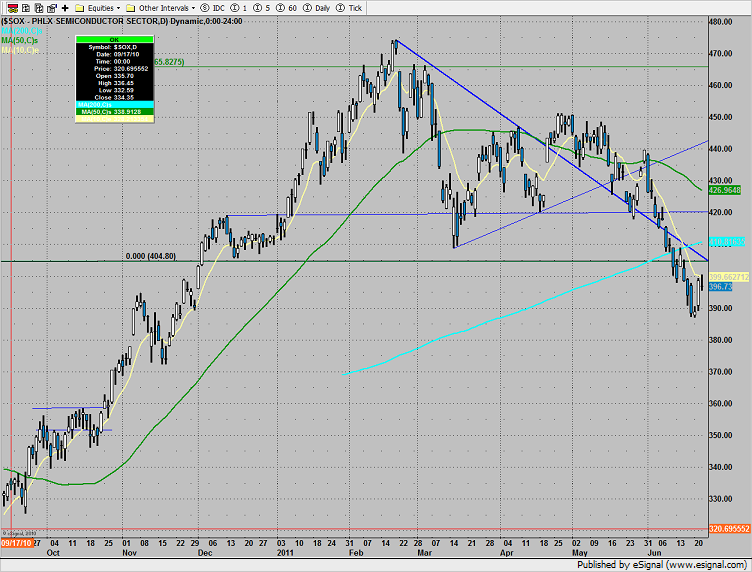
The SOX continues the bearishly underperform the Naz. Price remains below the 10ema.
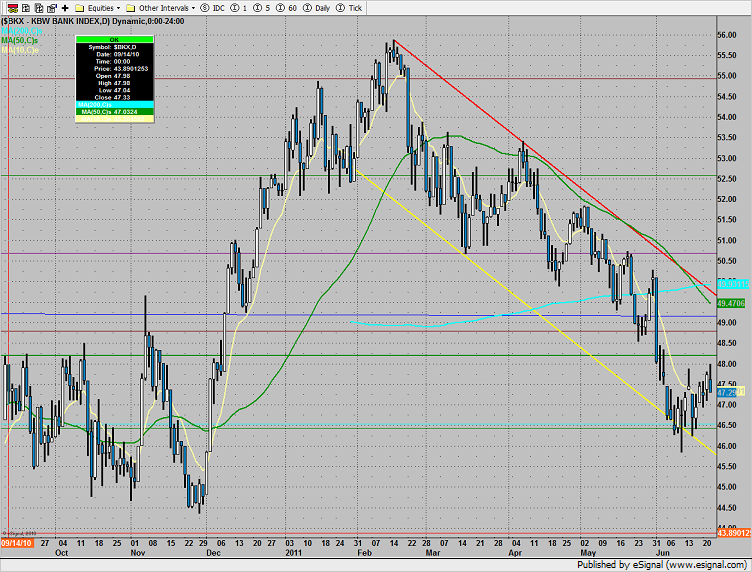
The BKX was almost twice as weak as the broad market but held above Tuesday’s low.
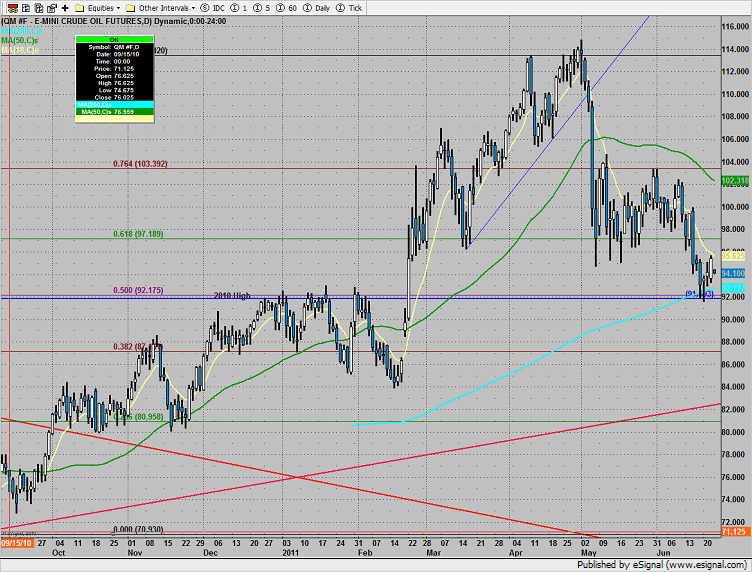
Oil is pinched between the 10 and 200 period moving averages. Once this is resolved it should move quickly.
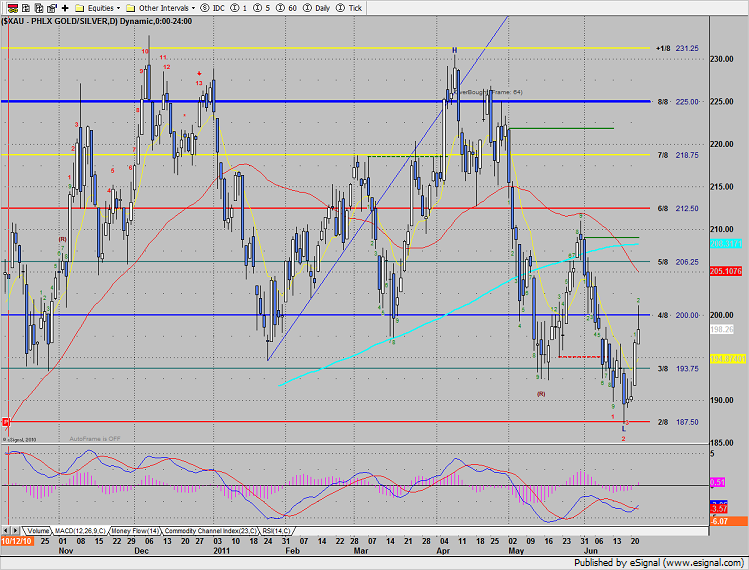
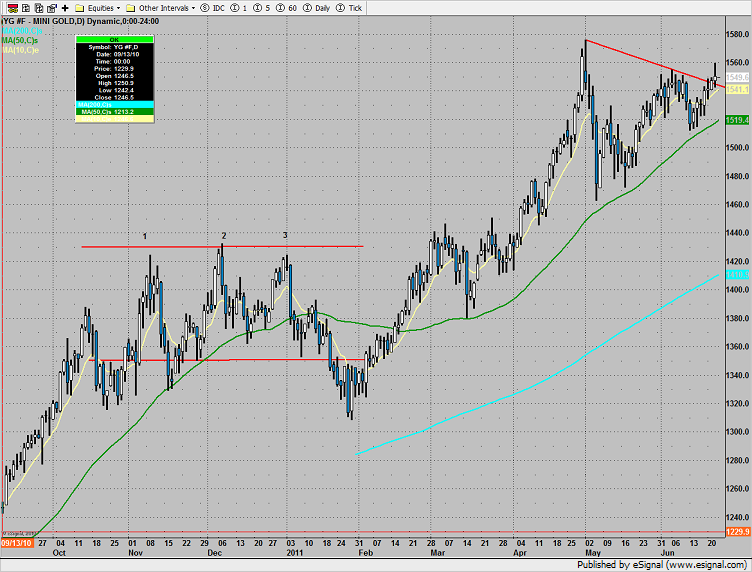
Gold pushed above the DTL but did not record a new high on the move.
Tradesight Market Preview for 6/23/11
June 22, 2011
|In Tradesight
Tradesight Market Preview for 6/23/11
June 22, 2011
|In Tradesight
The SP posted a very sloppy day on the chart, losing 8 on the day and closing at the dead low. Late in the day, after Fed chairman Bernake signaled that there will be no QE3, bids evaporated and enthusiasm left town. The technicals remain unchanged though the bulls didn’t put up a fight to register a measuring day to build on. Instead the chart now has a compromising midrange king and queen pattern on the chart which implies a break under Tuesday’s low would turn the pattern back to short-term negative (a loss of the 10ema). Keep in mind that the MACD still has a positive cross and the CCI has yet to get overbought.
On a relative basis, the Naz was considerably stronger than the SP. Compared to the SP the Naz put in a measuring day where price held above the midpoint of the prior day’s range. Both the Naz and the SP settled right at the 10ema. 2250 is the next hurdle for the bulls.
Multi sector daily chart:
The XAU was top gun taking a shot at the 4/8 level. There is still a considerable amount of upside room for more of a bounce before overhead begins with the declining 50dma.
The OSX was green and recorded the second day up in the Seeker sell setup. Price remains below the active DTL.
The BTK was about unchanged.
The SOX continues the bearishly underperform the Naz. Price remains below the 10ema.
The BKX was almost twice as weak as the broad market but held above Tuesday’s low.
Oil is pinched between the 10 and 200 period moving averages. Once this is resolved it should move quickly.
Gold pushed above the DTL but did not record a new high on the move.