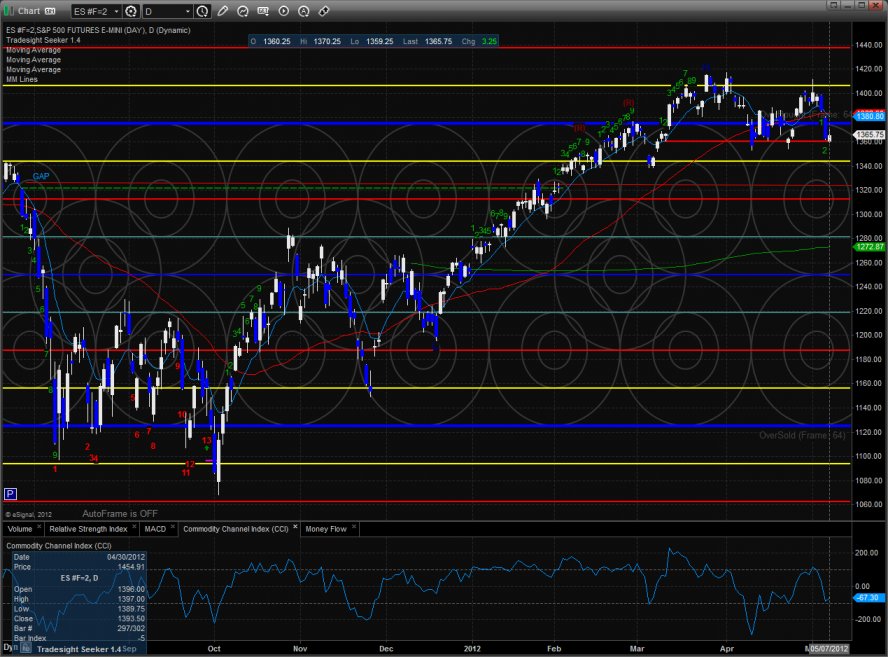
The ES gapped down opening at the active static trend line then rallied up to close high on the day by 3 handels. Keep in mind that while the bulls saved the one day, price remained in the lower half of Friday’s down candle.
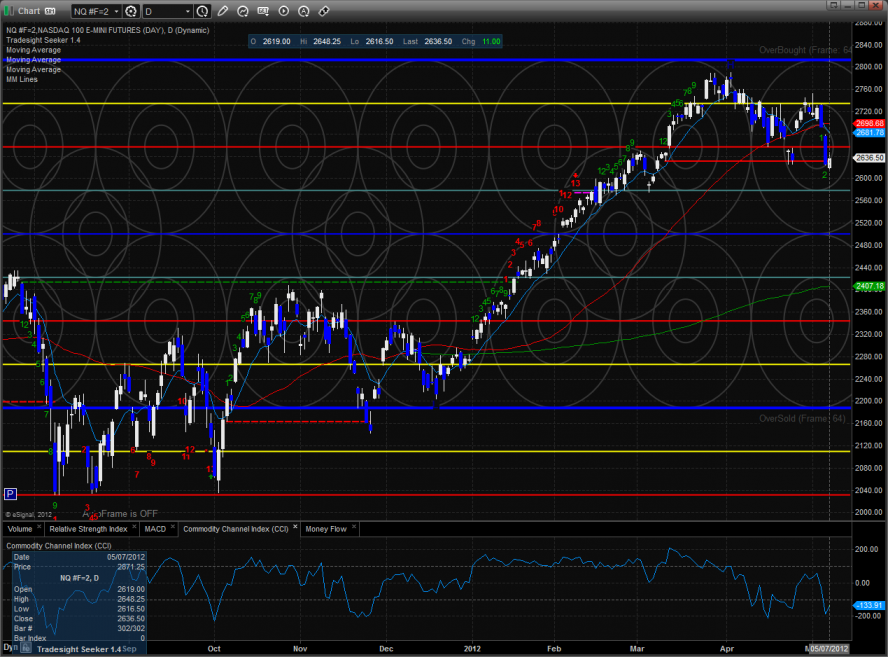
The NQ futures posted a similar session. The big break remains on the chart with a lower high on the chart. Price is bearishly below the 10 and 50 period moving averages.
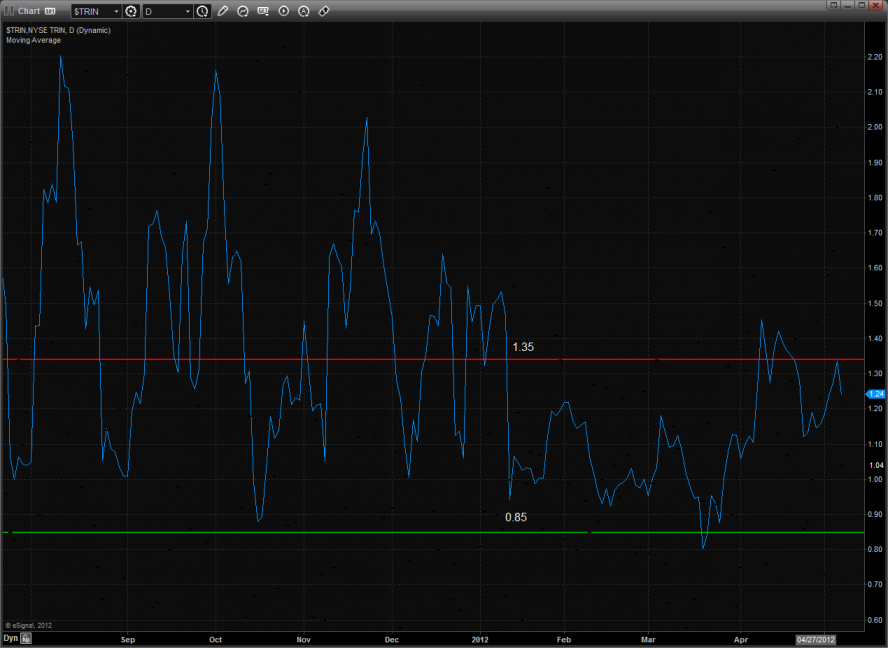
10-day Trin:
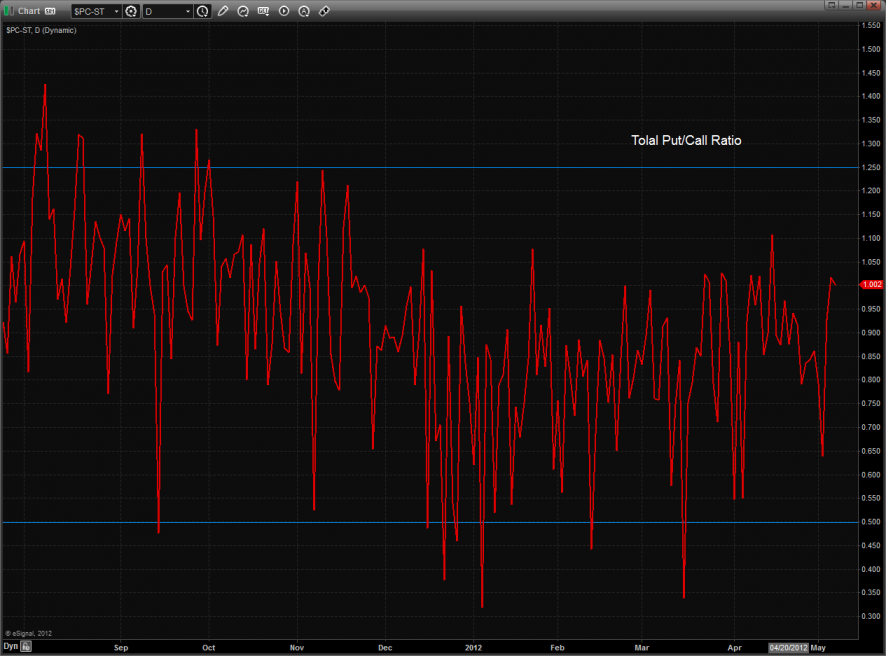
The put/call ratio remains neutral.
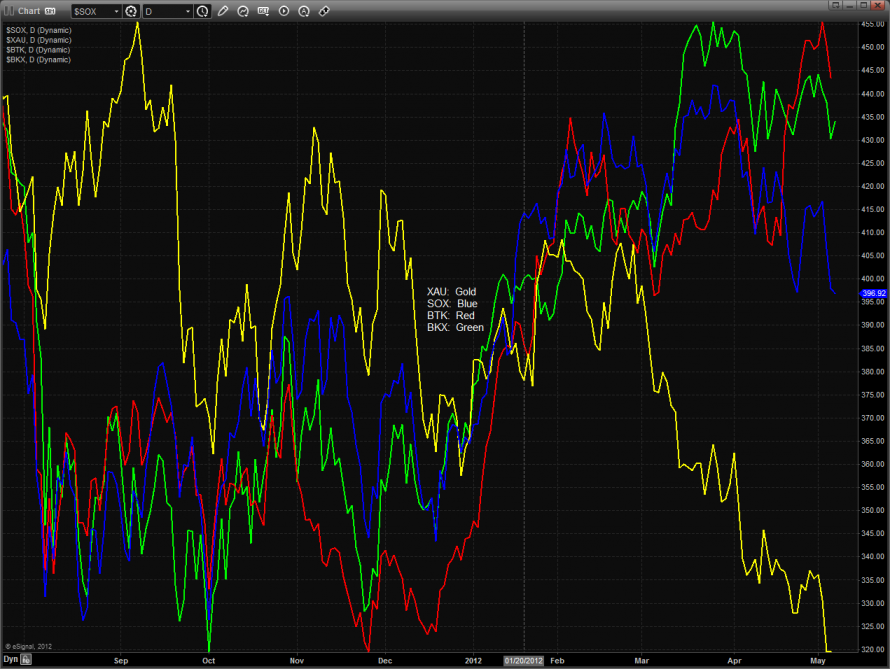
Multi sector daily chart:
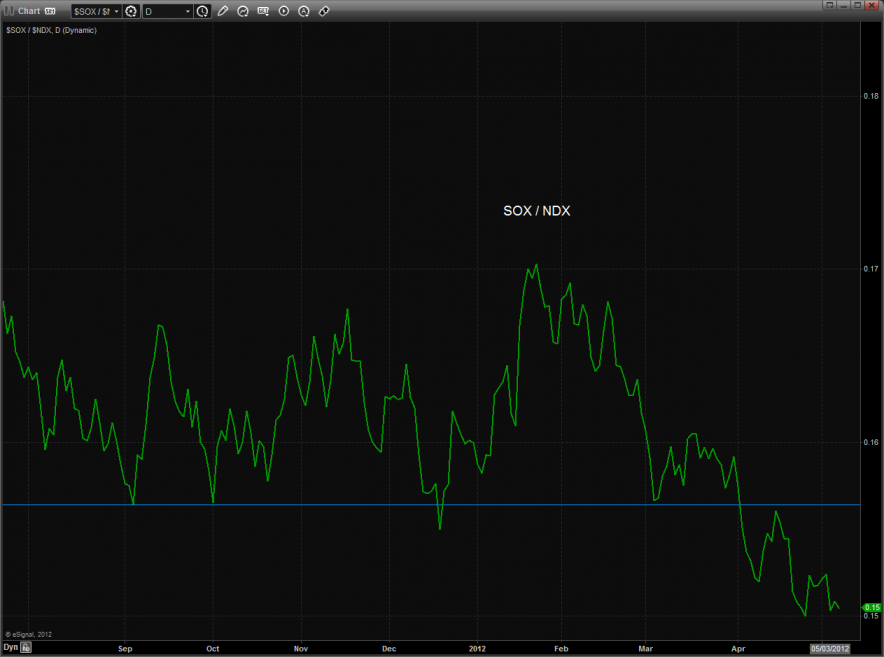
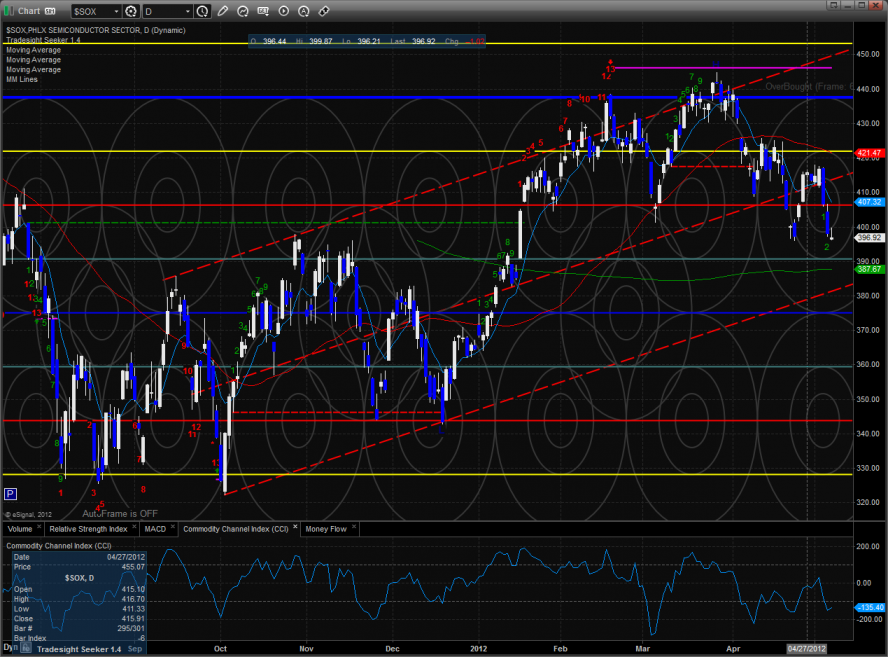
The SOX/NDX cross is near the prior low showing weakness in the SOX. A break to new lows would be very bearish for the overall NDX.
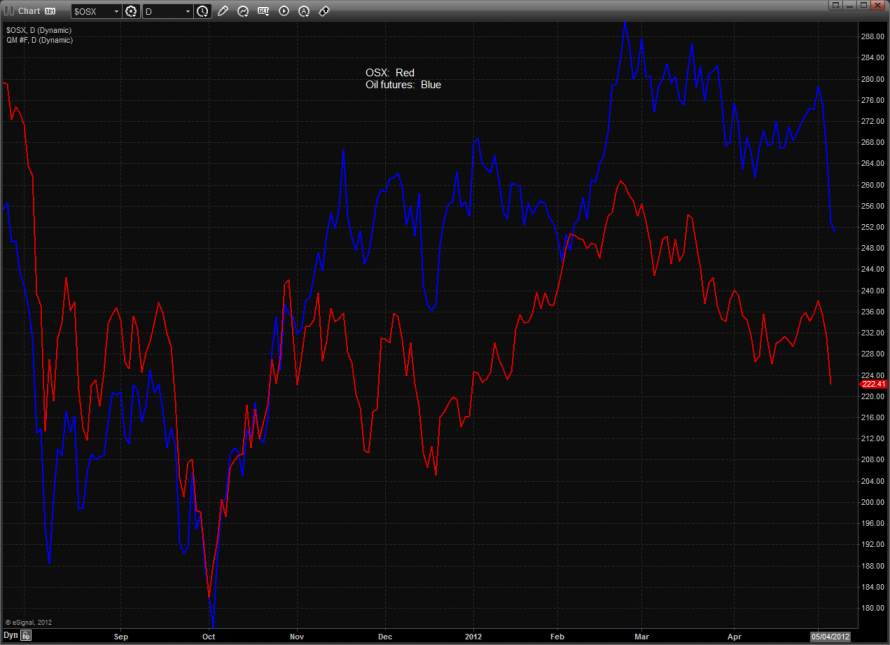
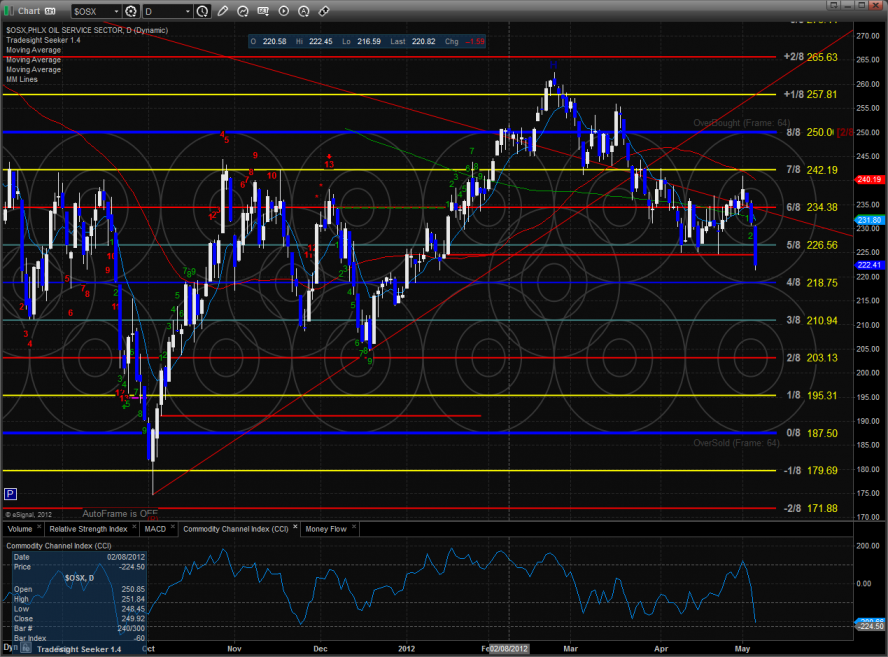
The OSX continues its bearish posture and is weighing down the underlying crude futures. This is a classic bearish condition for oil.
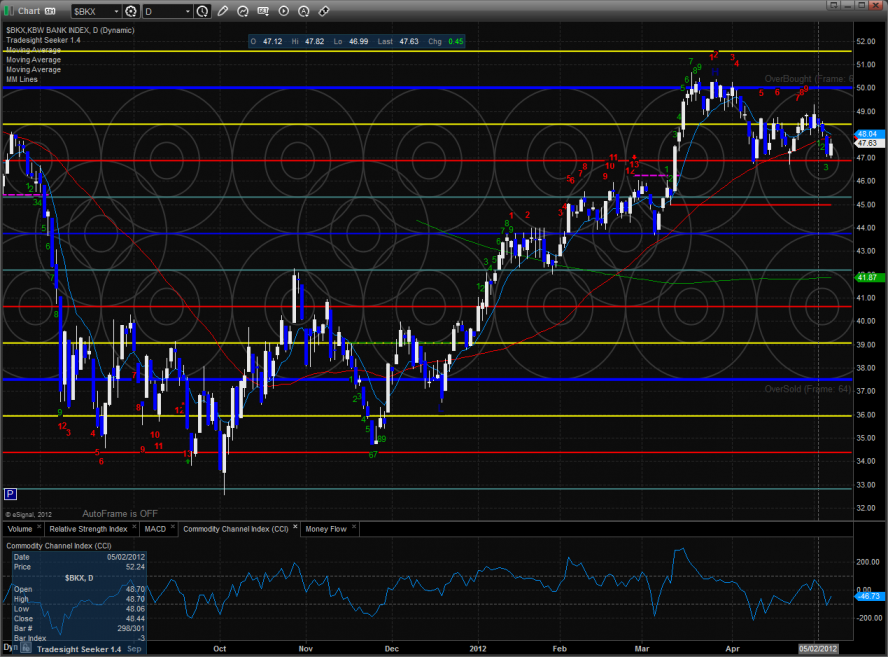
The one small positive is that the BKX is holding onto its relative strength vs. the SPX.
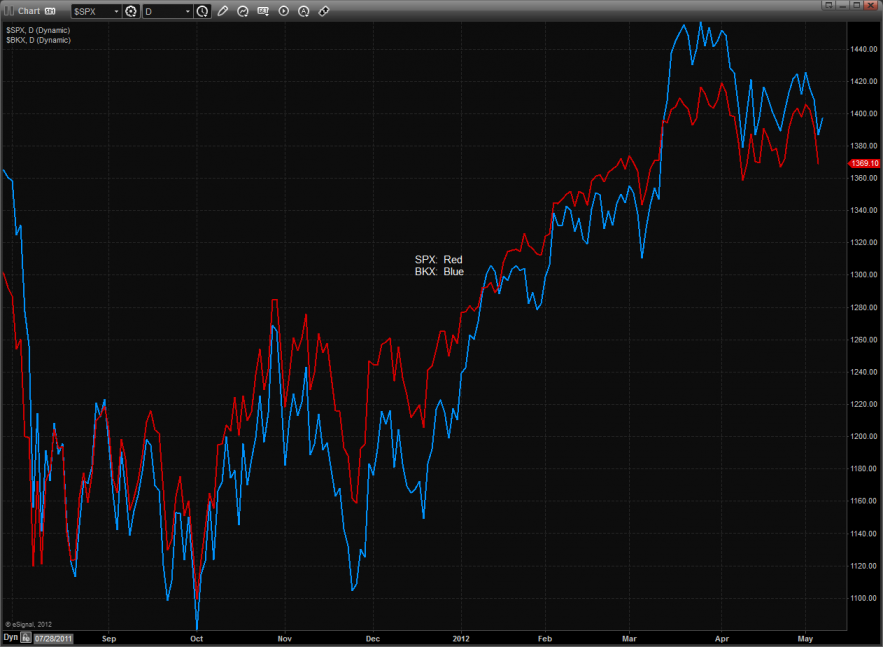
The BKX was relatively strong on the day up almost 1%. The February highs have been providing strong support and the daily chart is forming a bullish declining wedge formation.
The SOX was weak on the day using the prior low for support. This chart still could decline to the lower trend channel.
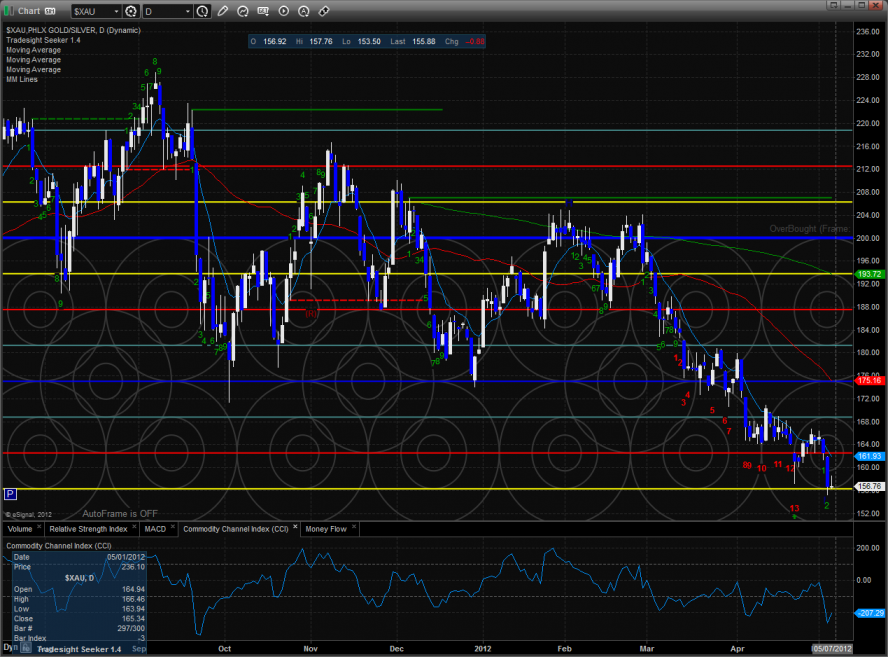
The XAU matched the old low but didn’t break. Be careful that this isn’t just a measuring day that gives way to further downside continuation.
The OSX was the last laggard on the day and broke key support by closing under the static trend line. The next important level is the 4/8 and then the YTD lows. This is not what the bulls want to see because there is typically a bid under energy stocks when a recovery is underway and has teeth.
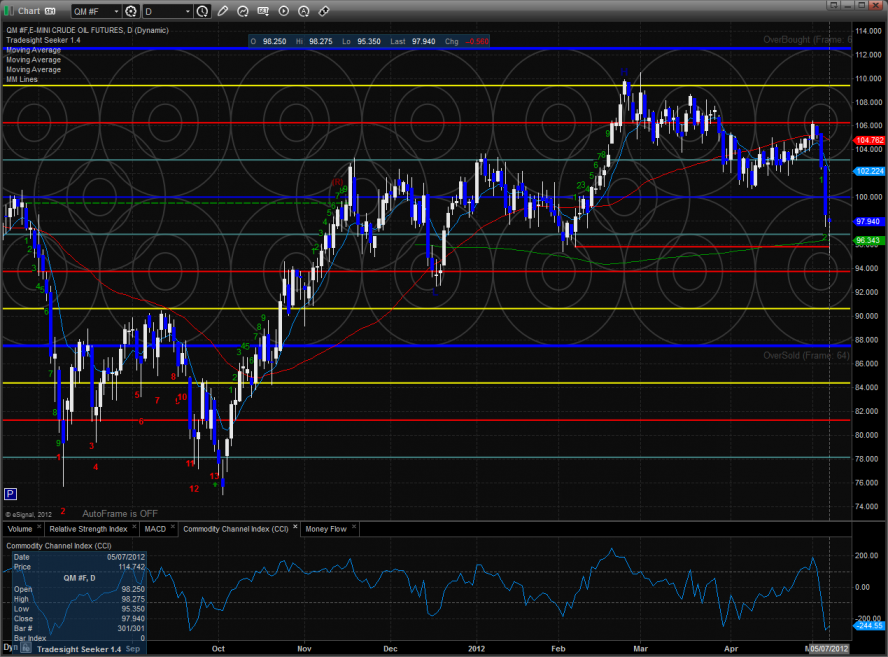
Oil:
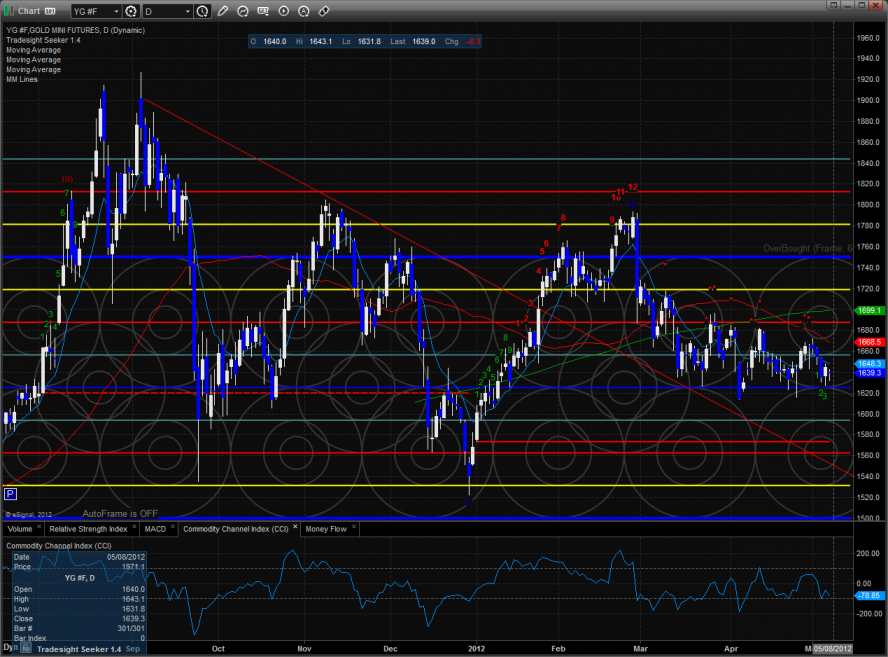
Gold:
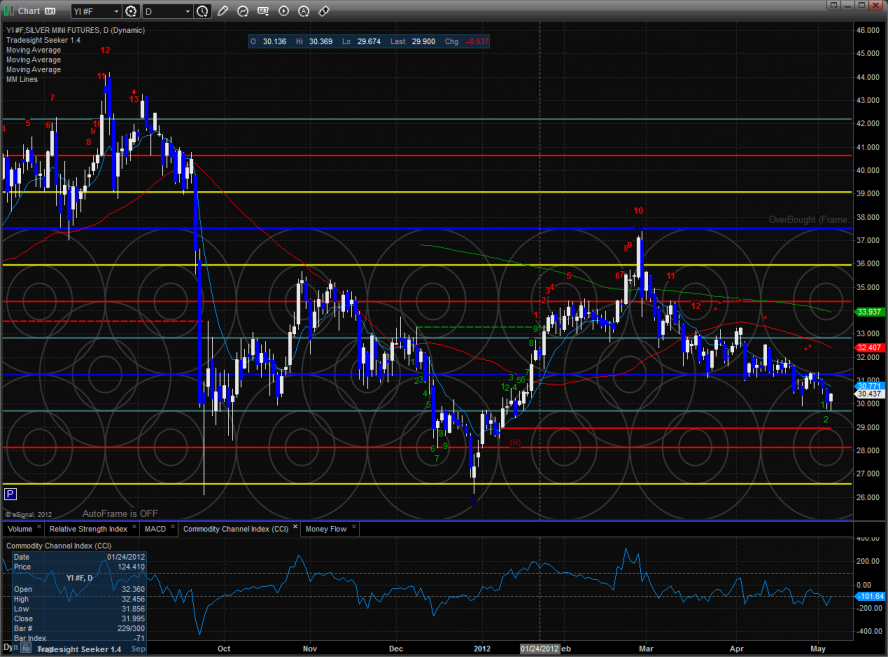
Silver:
Tradesight Market Preview for 5/8/12
May 7, 2012
|In Tradesight