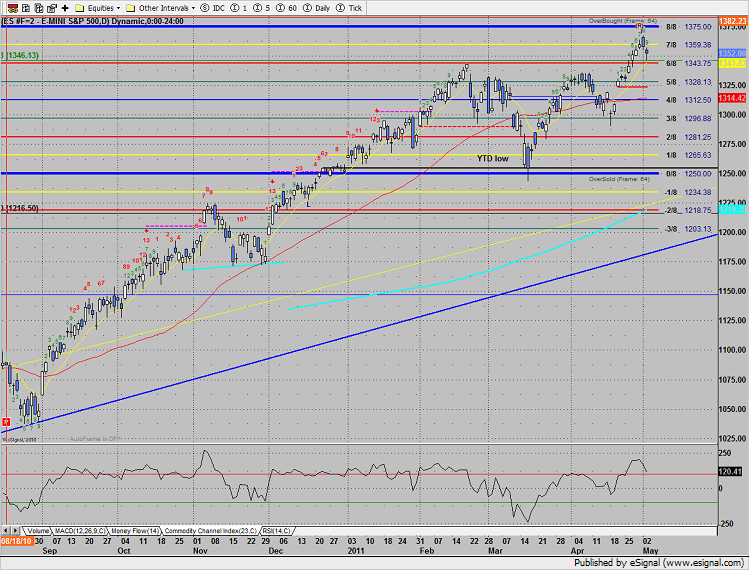
The SP lost 6 on the day, following through on yesterdays range high distribution candle. Note that the Seeker sell setup completed which recycled the Seeker exhaustion sell countdown. Price held above the 10ema and February high. This is now a key area of support.
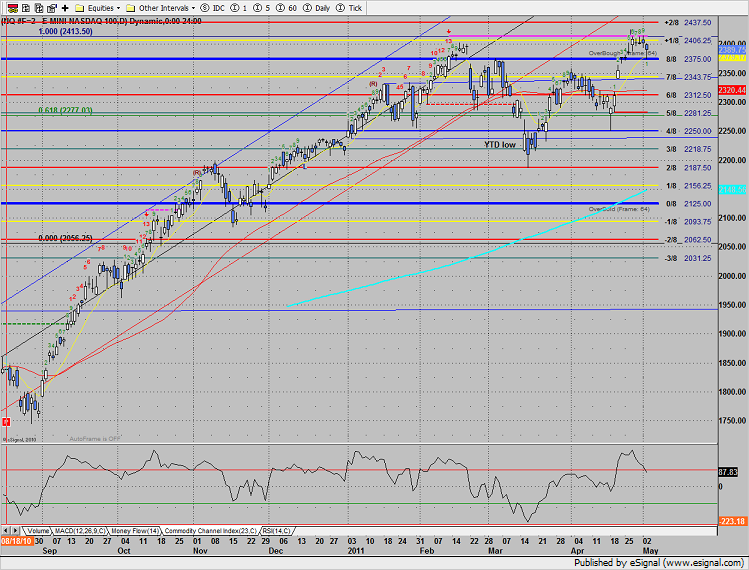
Naz was lower on the day but managed to close near the midpoint of the session which erases any momentum that the pattern was building. A close under the 10ema and 8/8 Gann level is the point where downside momentum will begin.
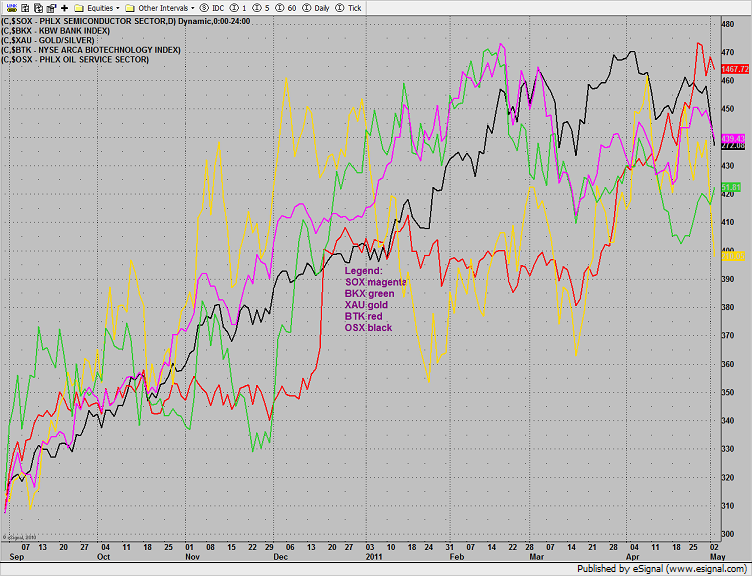
Multi sector daily chart:
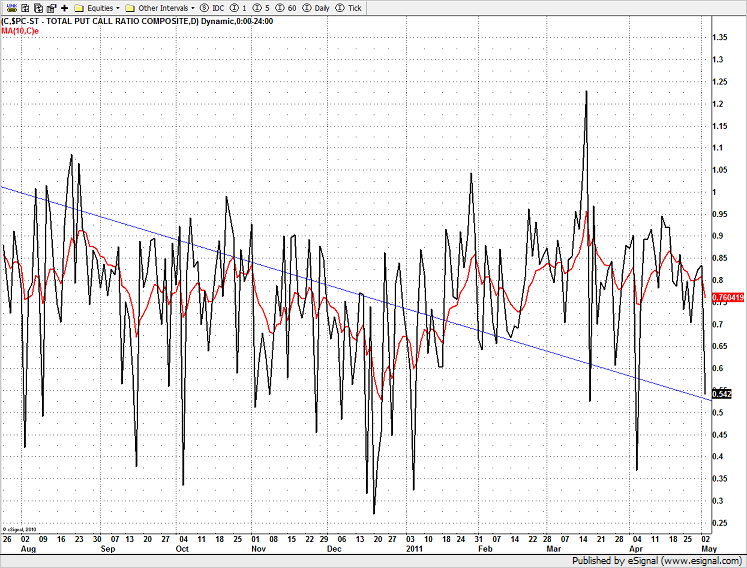
Interestingly the put/call ratio tanked which is a sign of complacency.
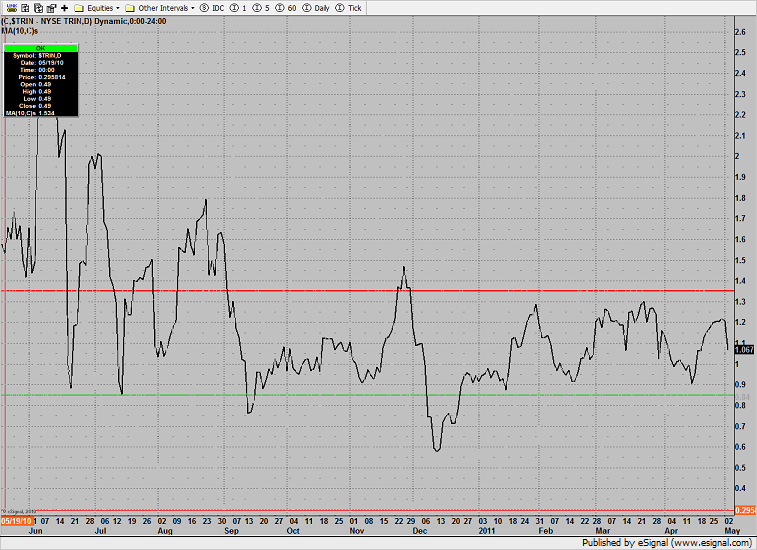
The 10-day Trin remains neutral which means there is gas in the tank for a move in either direction.
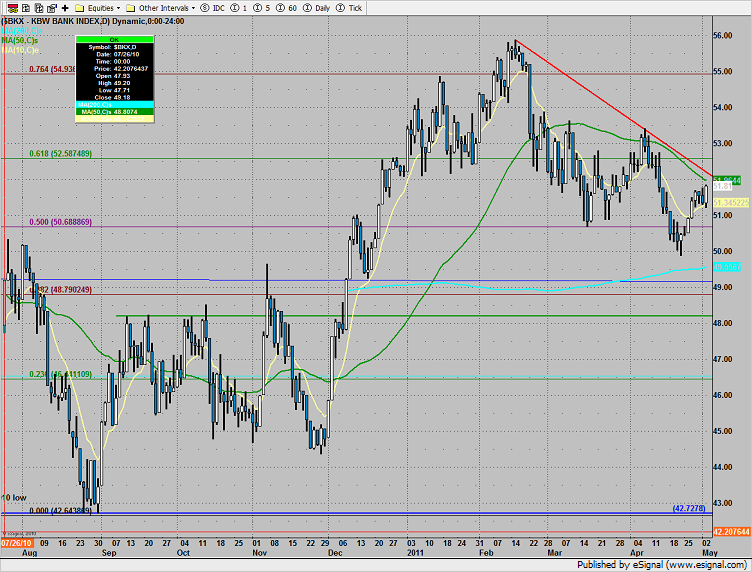
The BKX was the only major sector that was green. Two key areas to watch: The active DTL and the 50dma (green).
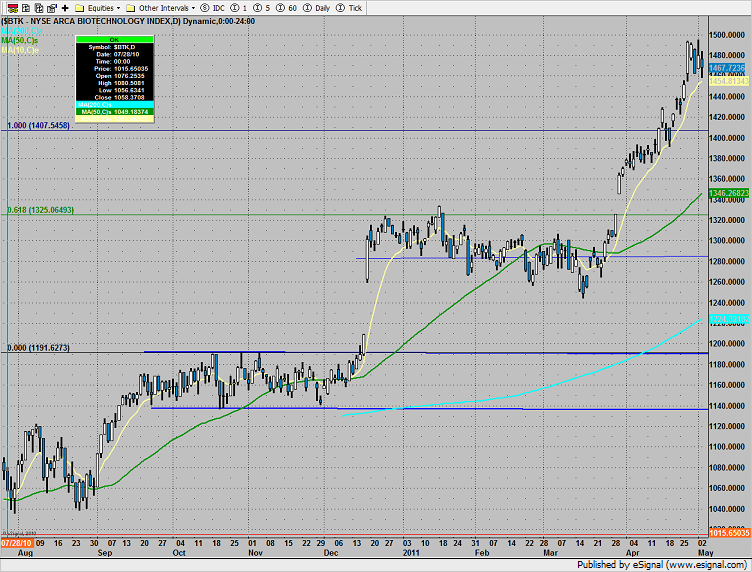
The BTK was lower on the day but essentially inside Tuesday’s real body, so nothing new technically.
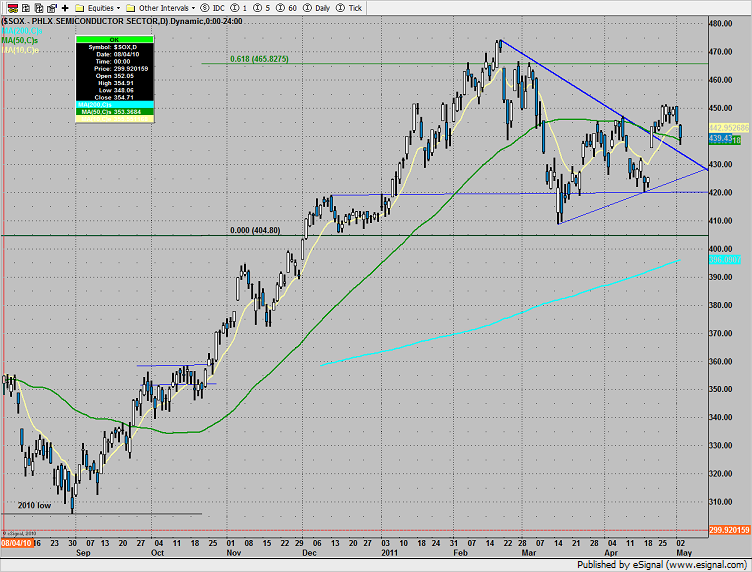
The SOX broke down to settle right at the 50dma. A second, minor DTL has been added to the chart.
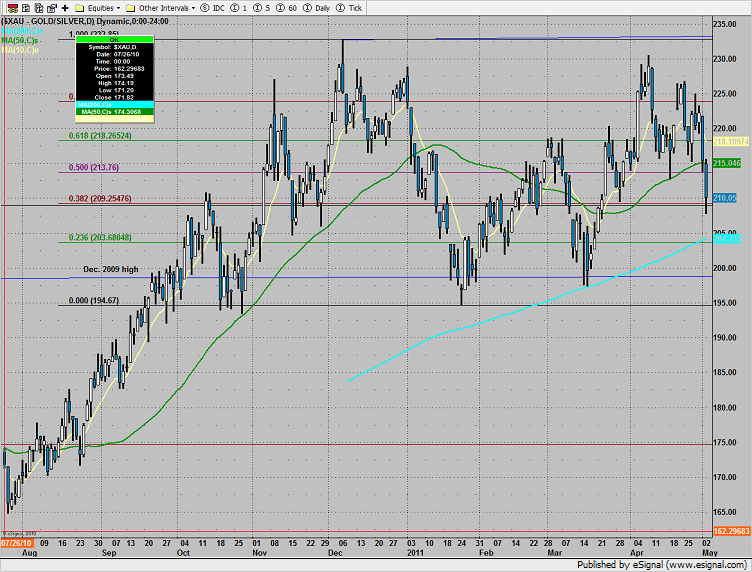
The XAU broke decisively below the 50dma, note how very subtly, the patter is tightening up. There are both high highs and lower lows present on the chart.
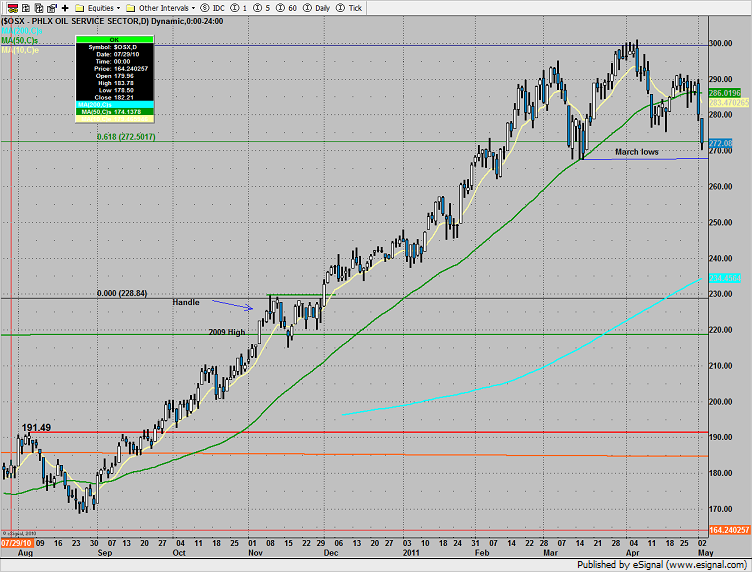
The OSX broke very hard and is now short-term oversold. The March lows are key support and also a major breakdown level.
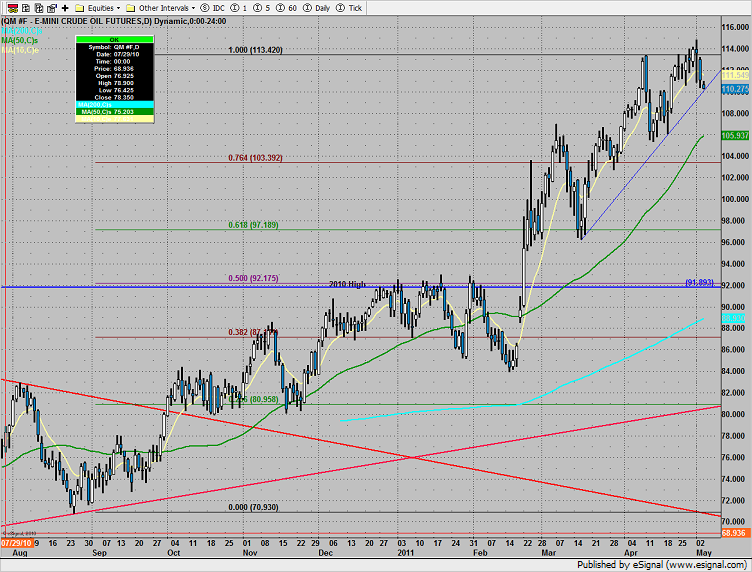
Oil was lower on the day, settling right at the rising DTL. 106.50 is the next support level if the DTL doesn’t hold.
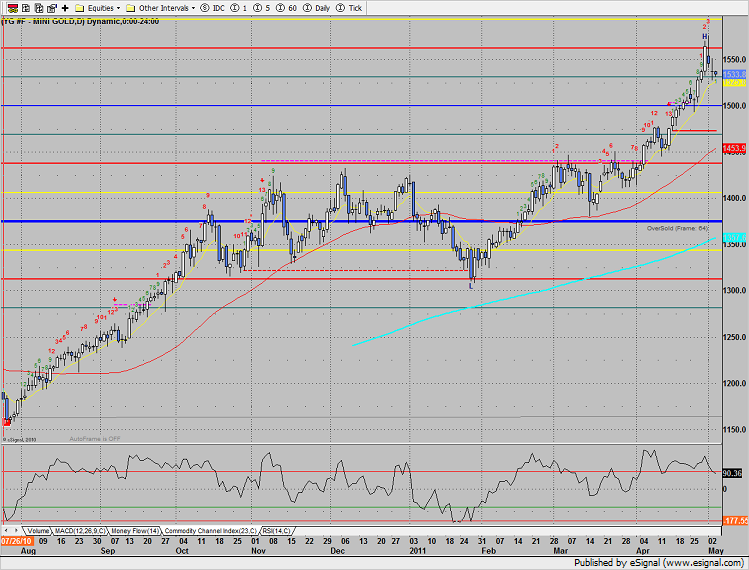
Gold futures got clocked and are starting to break. Look for a close under the 10ema for the first confirmation of a change in trend.
Tradesight Market Preview for 5/4/11
May 3, 2011
|In Tradesight