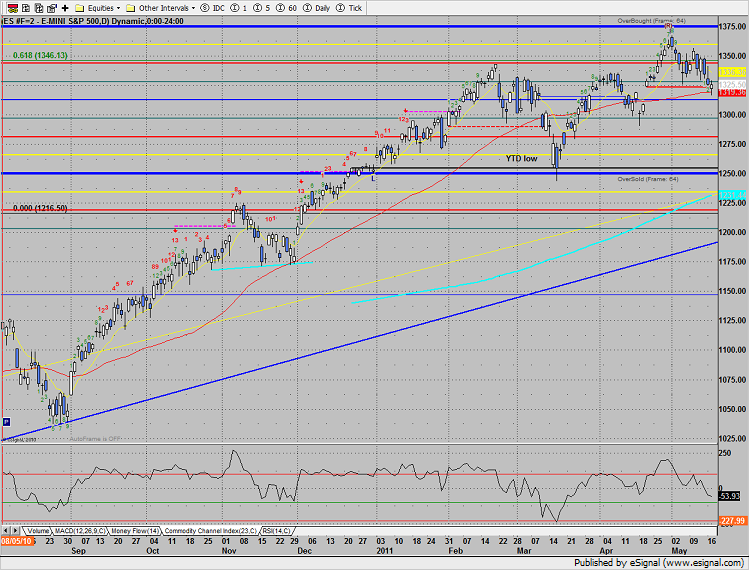
The SP closed unchanged after finding support at the 50dma. Note that Tuesday’s close is also the static trend line. This is a very key area of support.
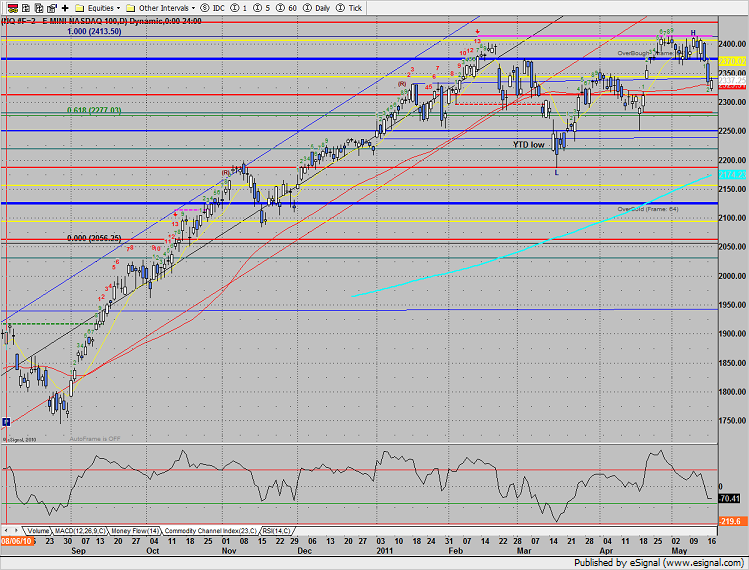
Naz was slightly higher on the day closing near the 50dma. The gap from early April is still open.
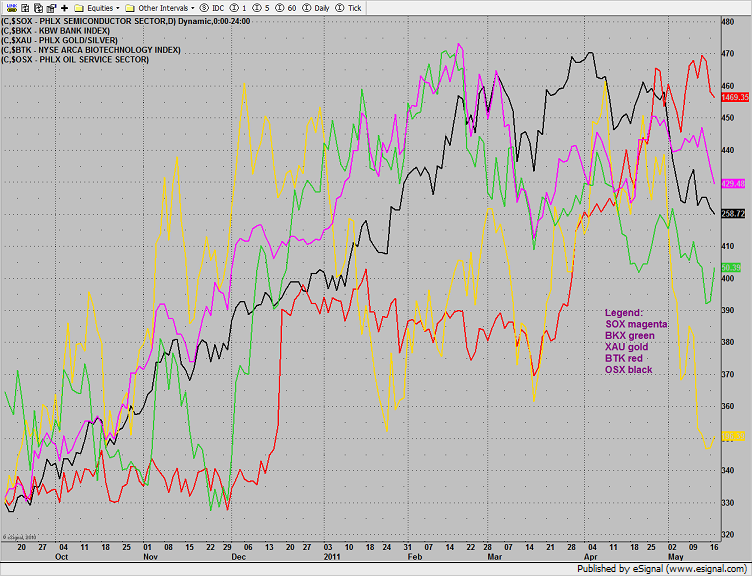
Multi sector daily chart:
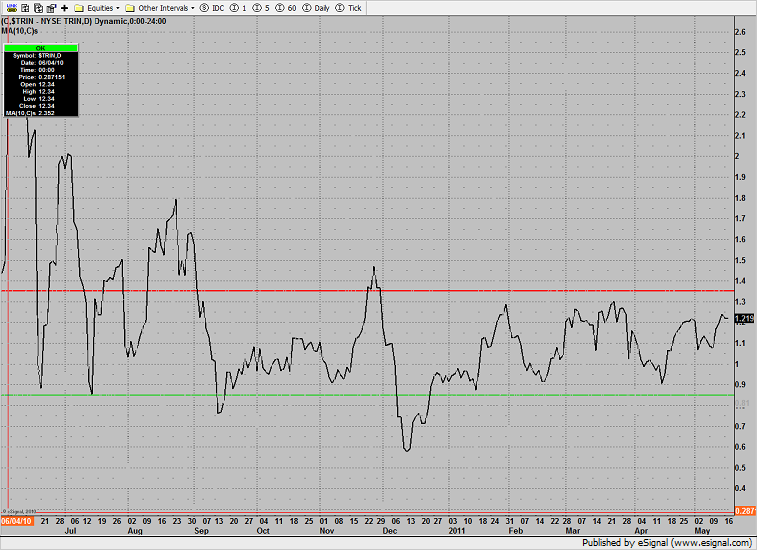
The 10-day Trin closed at 1.21, still below the 1.35 oversold threshold.
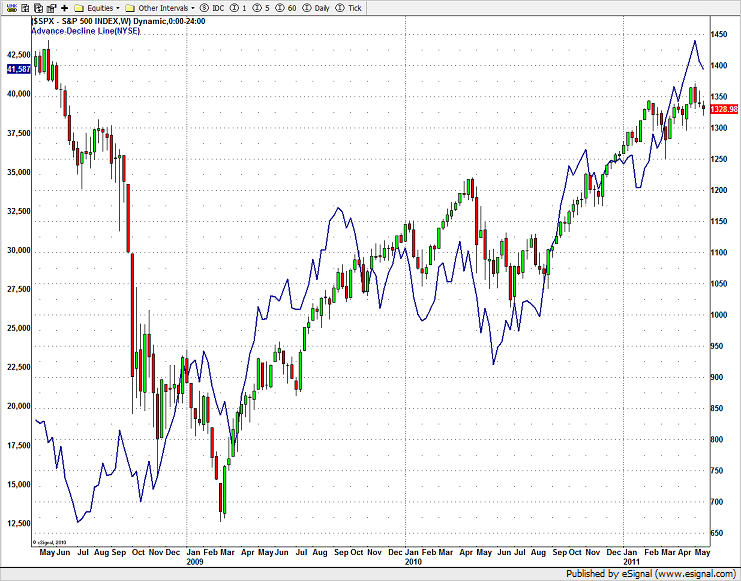
The cumulative NYSE A/D line took a hit which is consistent with the price action. This chart needs to be monitored to see if price bounces in the SP that the A/D line follows. A divergence on the bounce would be a strong indication that there is a more price correction in the cards.
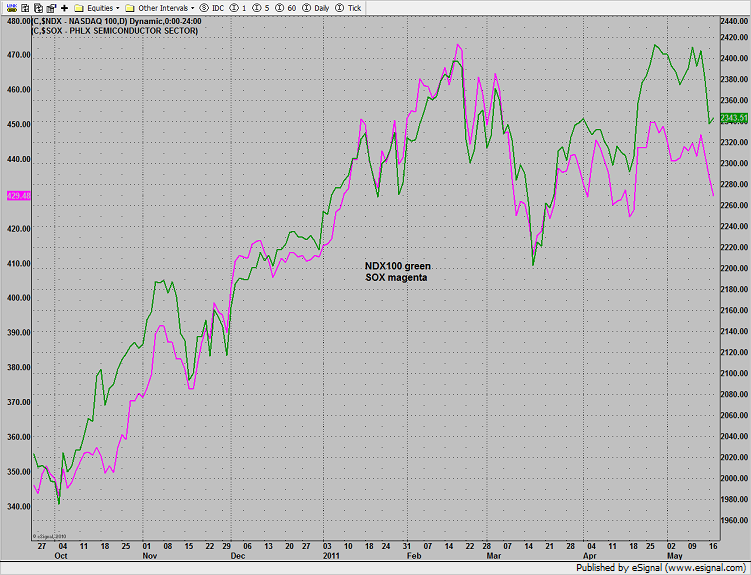
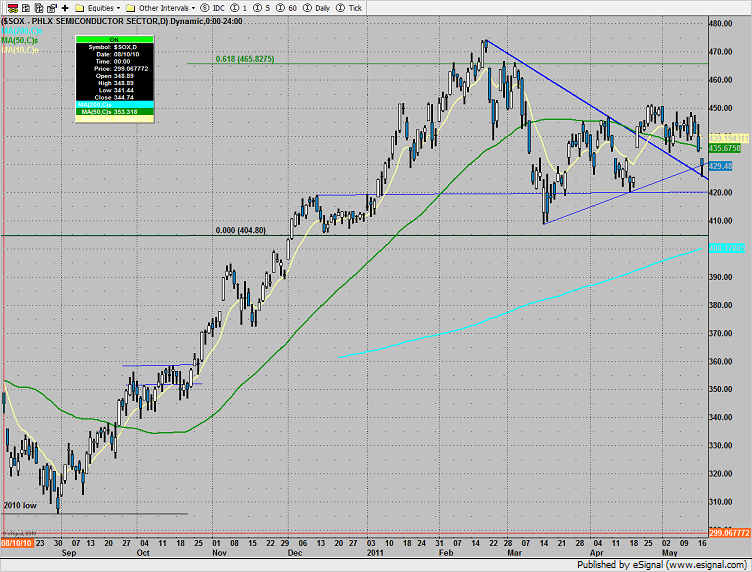
The SOX continues to underperform the NDX which is a very negative intermarket divergence and has bearish implications.
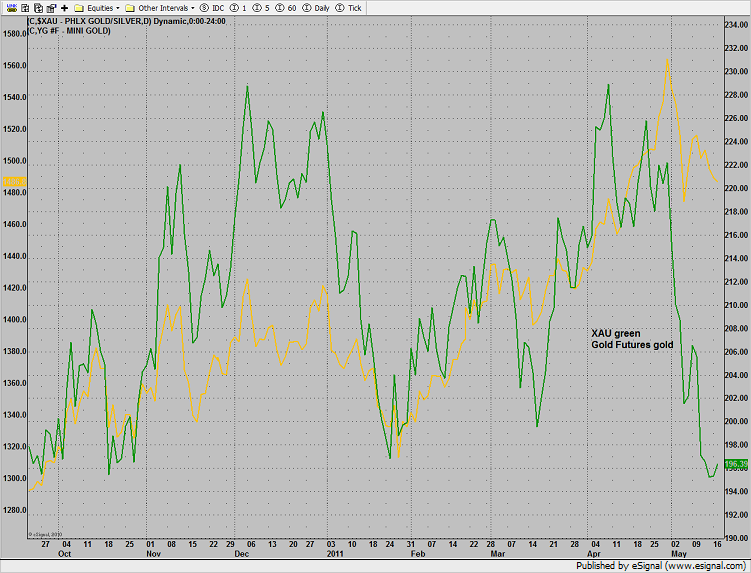
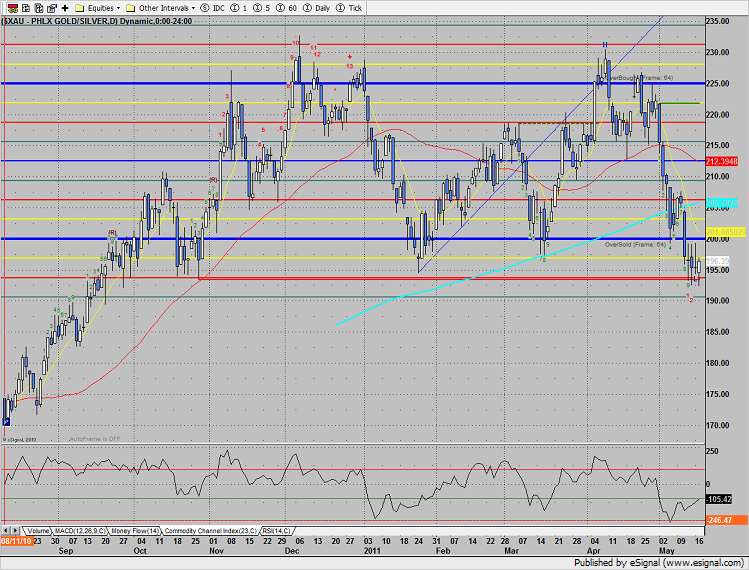
The bearish divergence between the XAU and gold futures has grown wide enough for some relief.
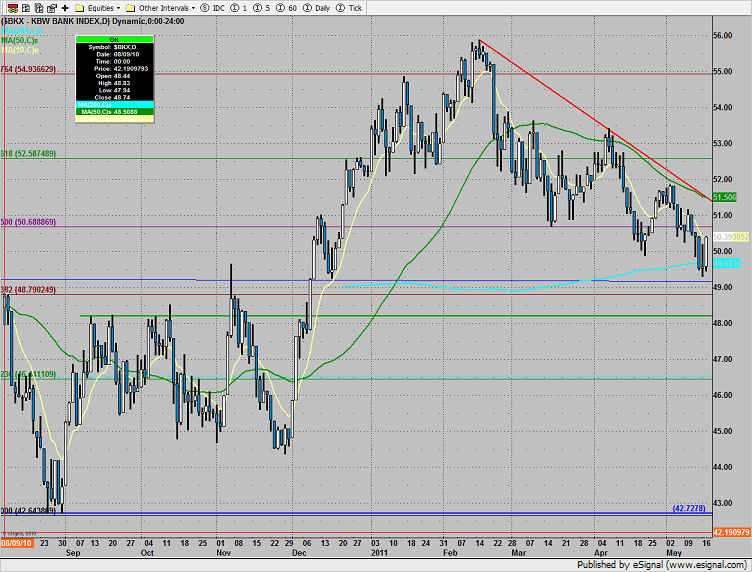
The BKX is doing some good work around the 200dma and closed top gun on the day.
The XAU is amazingly still finding support at the static trend line from October 2010! Look for a move back to the 200dma after price settles above the recent range.
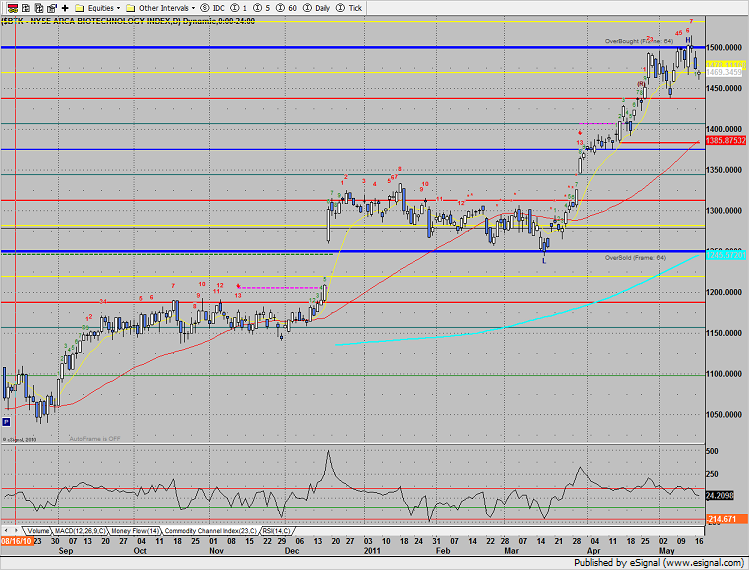
The BTK was little changed on the day.
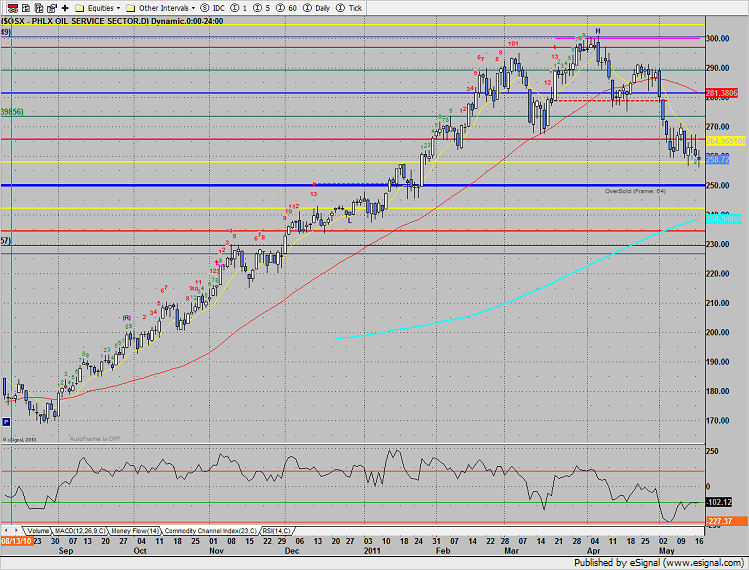
The OSX posted a new low close on the move but is losing downside momentum. Note how the CCI is now trying to curl up.
The SOX dropped and found support at the DTL fall back. This is never a welcome development for bulls.
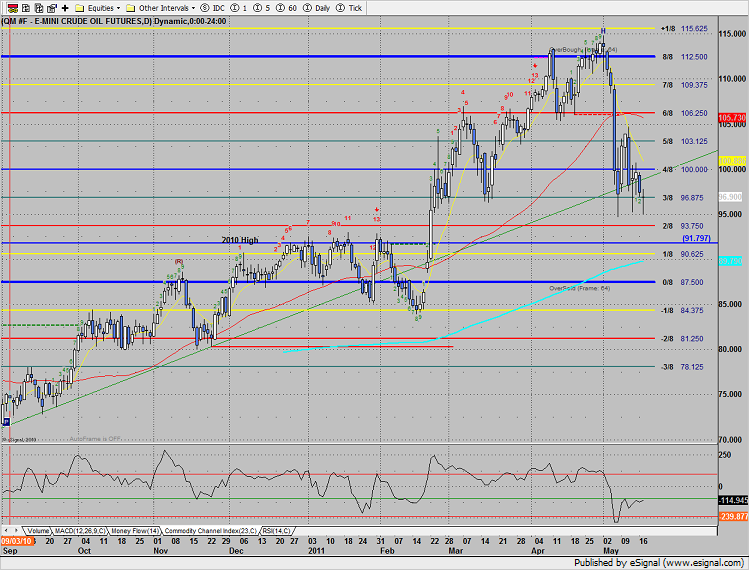
Oil settled right at the prior low close on the move.
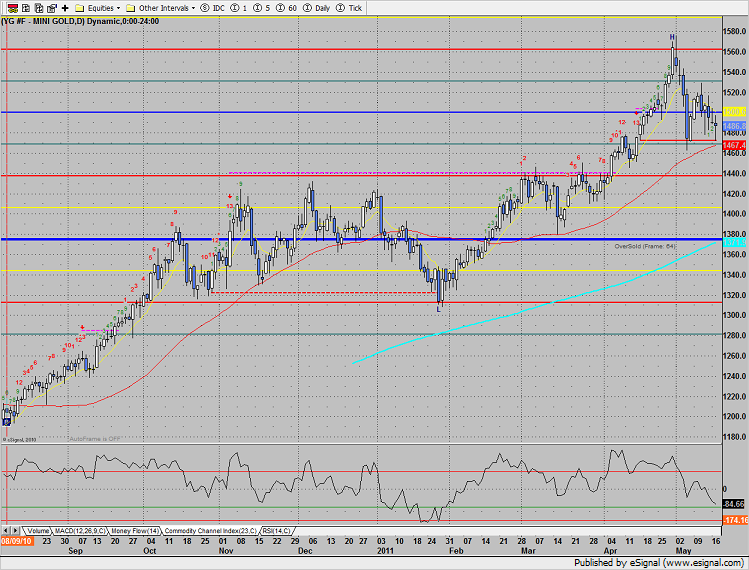
Gold lost 4 on the day, still holding above the 50dma and static trend line.
Tradesight Market Preview for 5/18/11
May 17, 2011
|In Tradesight