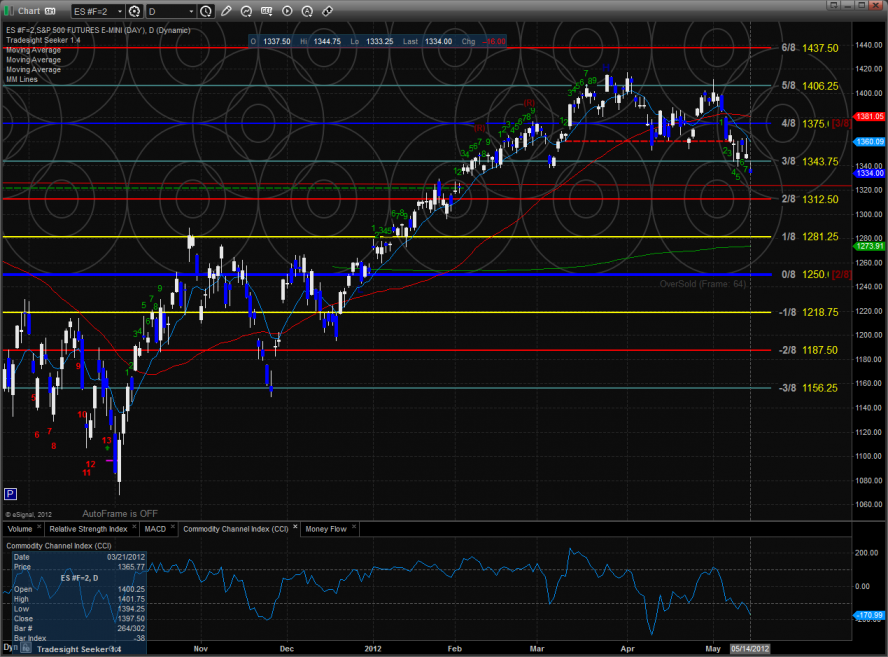
The ES lost 16 handles on the day making a new low on the move. Price undercut the key 2 bar island made in early March and has qualified the lower high set in late April. The Seeker count is now 8 days down so the broad market could see a bounce later this week.
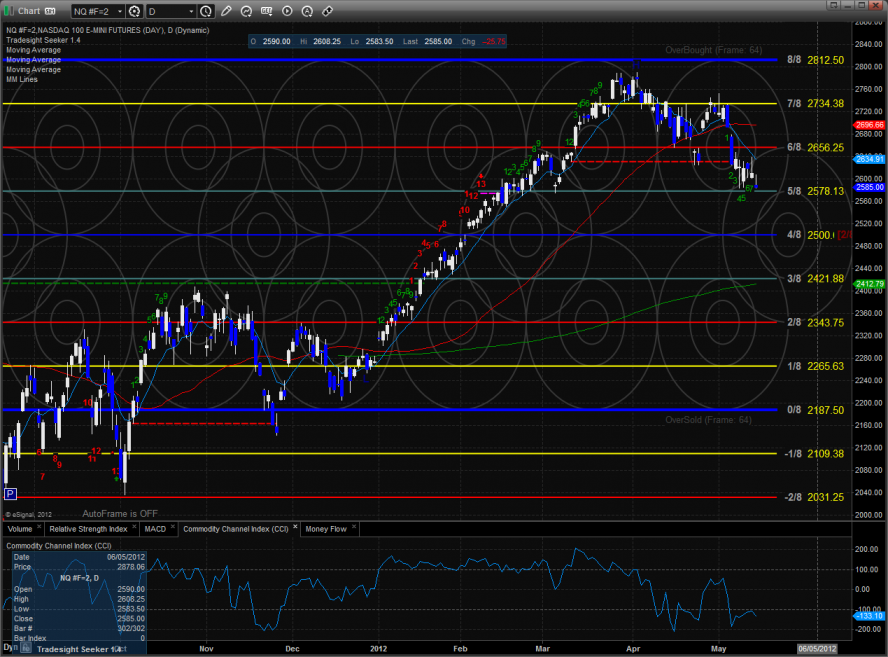
The NQ futures made a new low close on the move. Price is below all the important major moving averages and is in a short-term down trend. Like the ES, the NQ futures are 8 days down so either a lateral move or bounce is on deck. Note how the early March lows are key support.
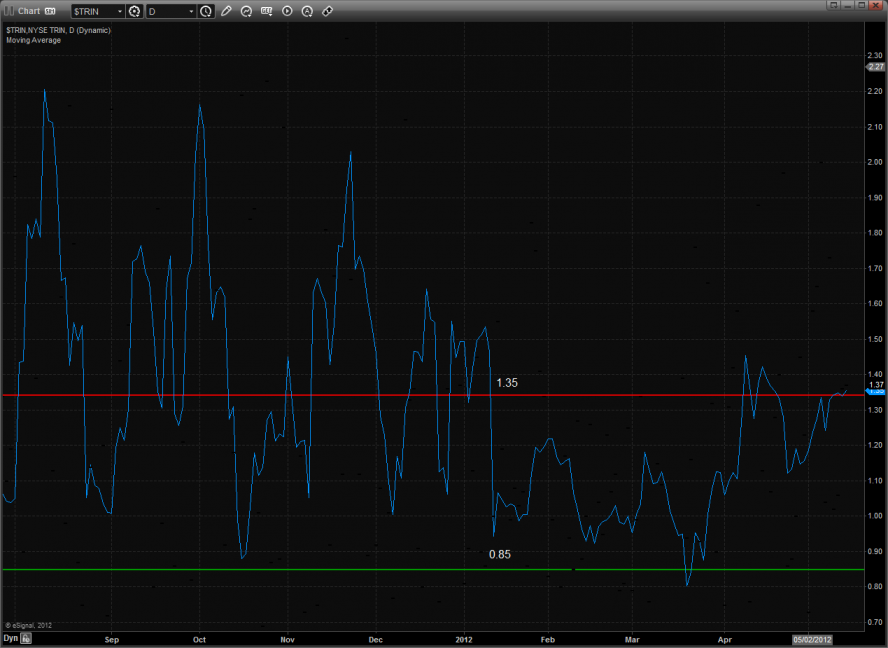
The 10-day Trin is still hovering around the oversold threshold.
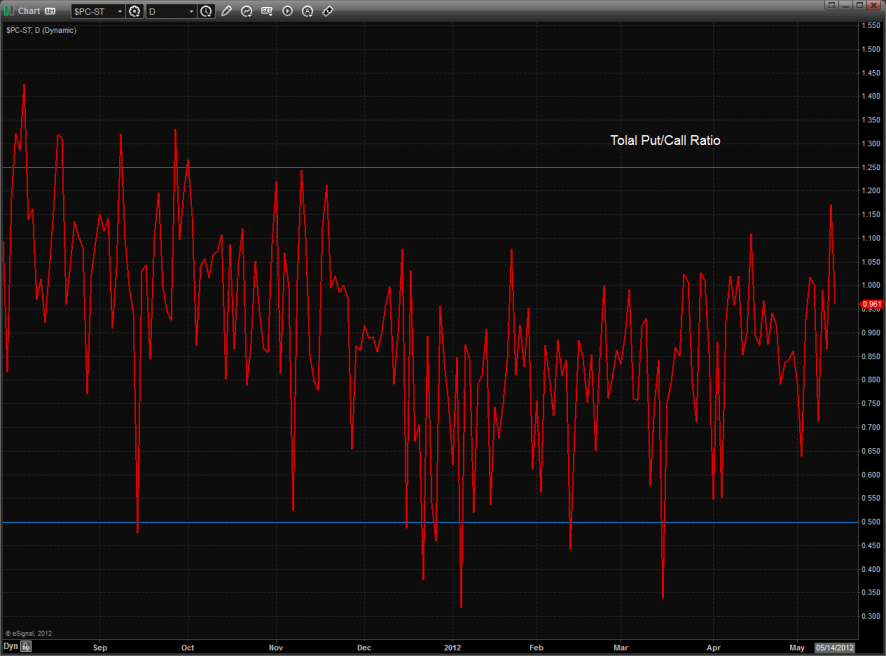
The total put/call ratio remains neutral.
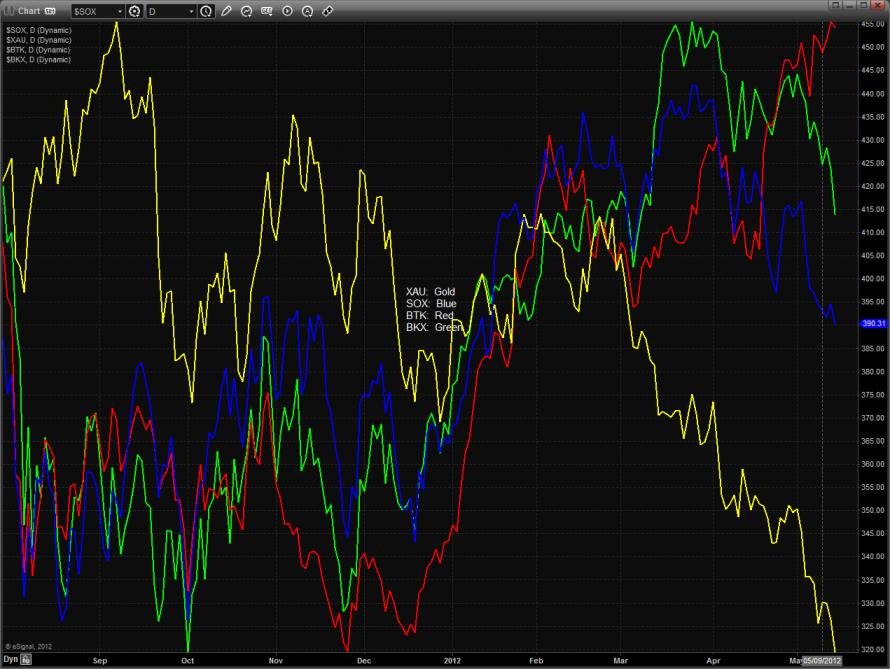
Multi sector daily chart:
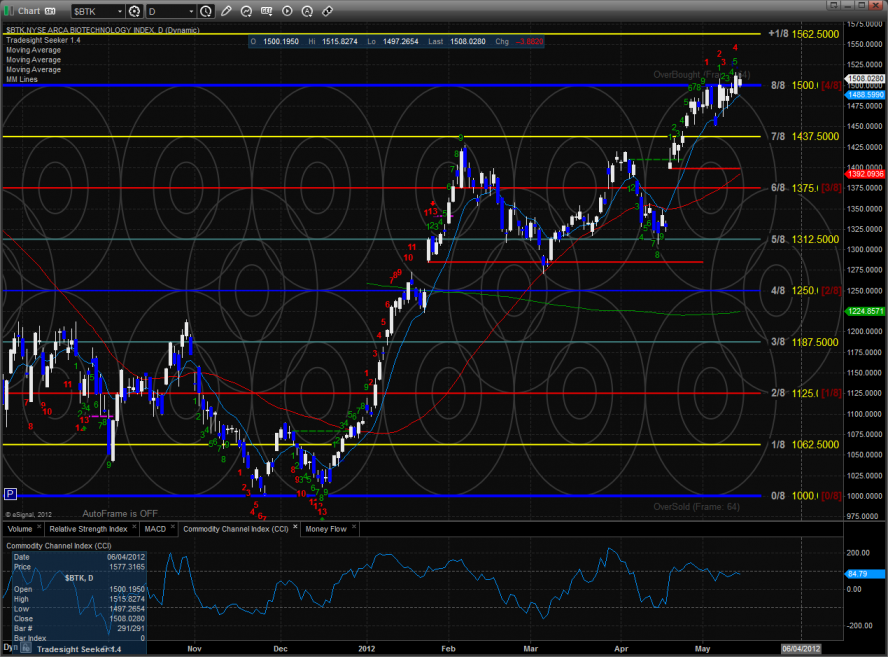
All of the major moving averages were red on the day with the BTK being the strongest. It was in insicde day but net another accumulation session with price closing above the open.
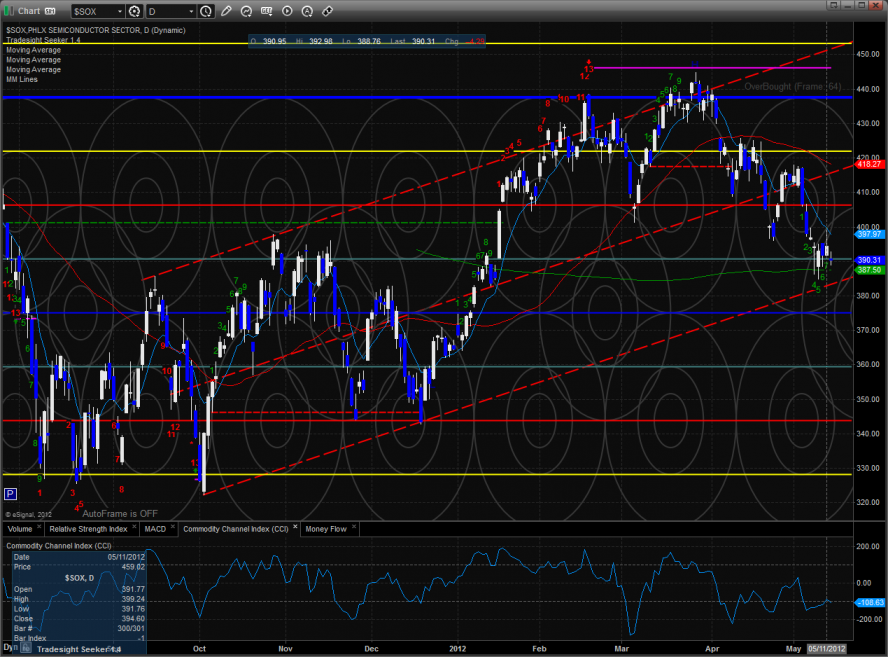
The short term oversold SOX was stronger than the broad market one the day. Keep a close eye on the 200dma and the lower trend channel which together are key support.
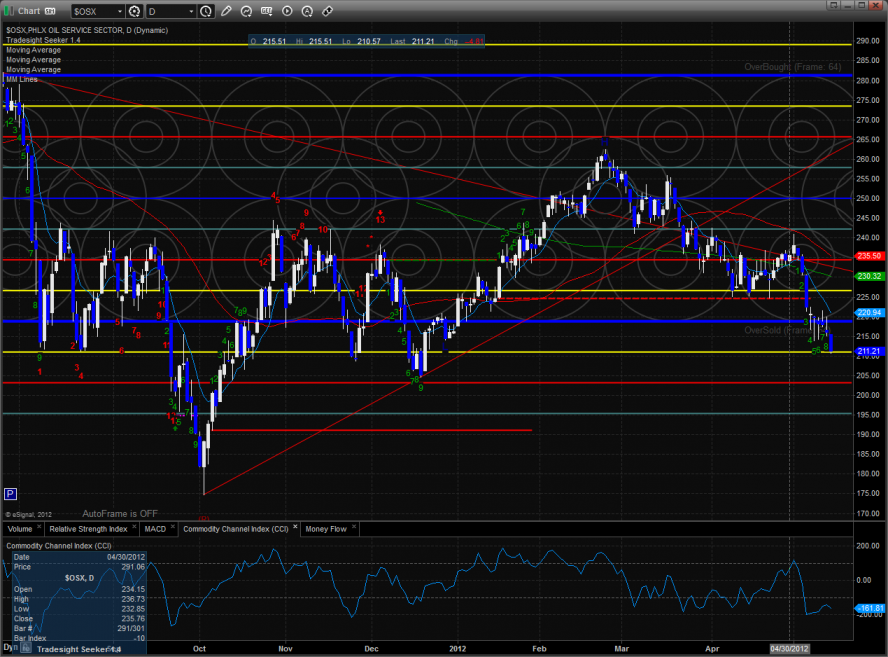
The OSX made a new low on the move and is now 9 days down on the Seeker count.
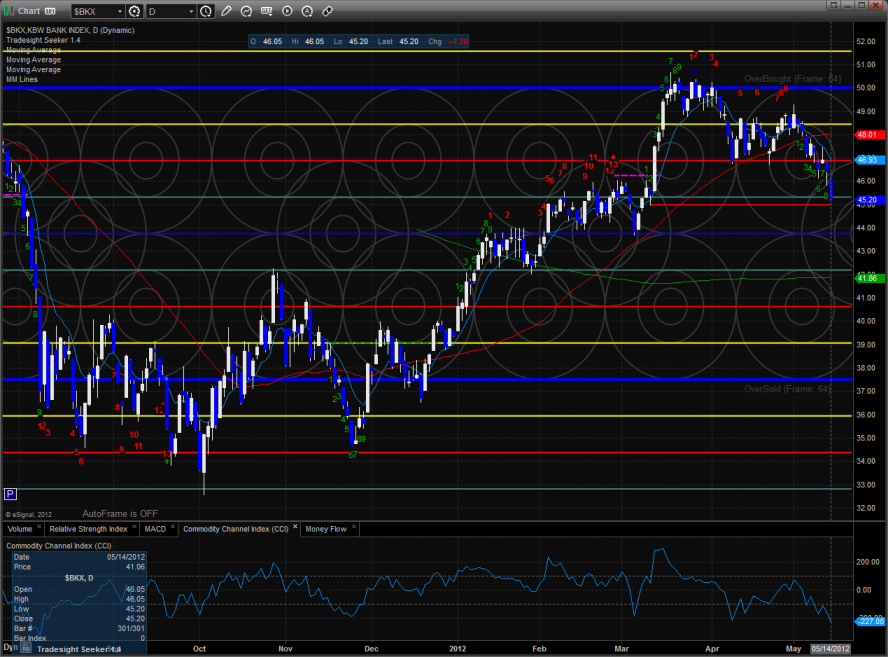
The BKX was hit hard and much weaker than the broad market. The pattern is now 9 days down and just above key support at the static trend line.
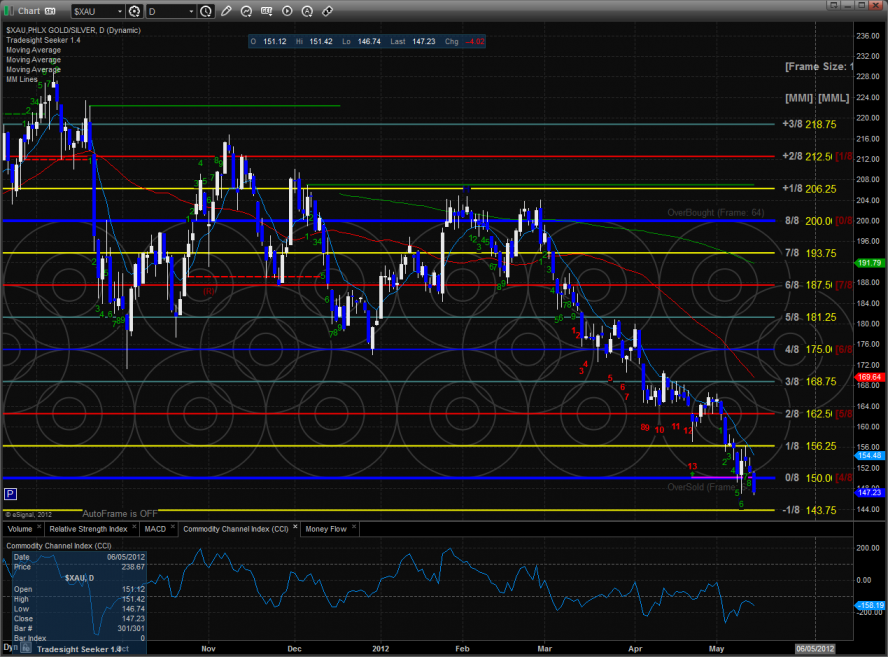
The XAU recorded its first close below the Seeker risk level. A new intraday low would nullify the buy signal though it’s unlikely in the next 48 hours because of the new 9 bar setup that just completed.
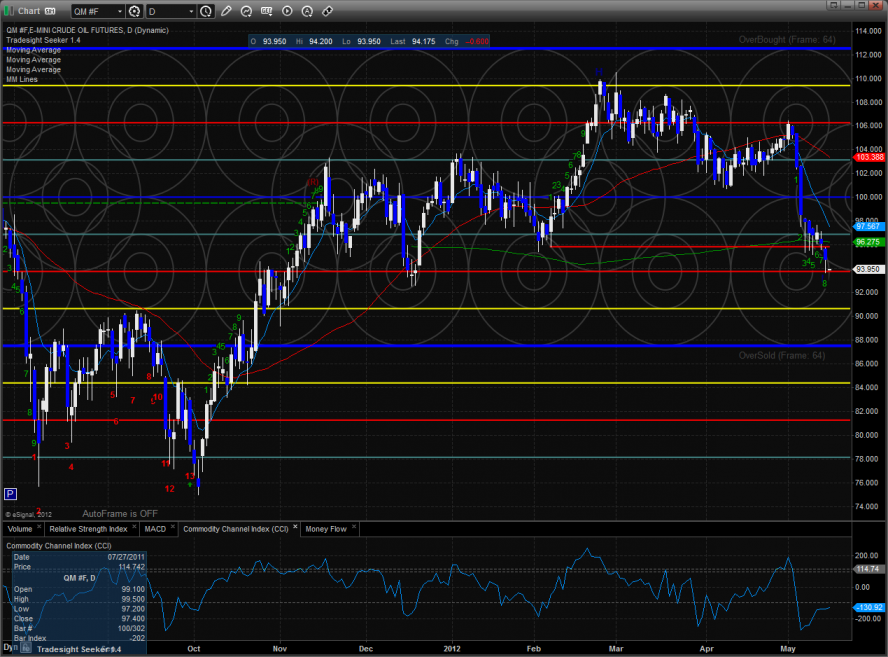
Oil:
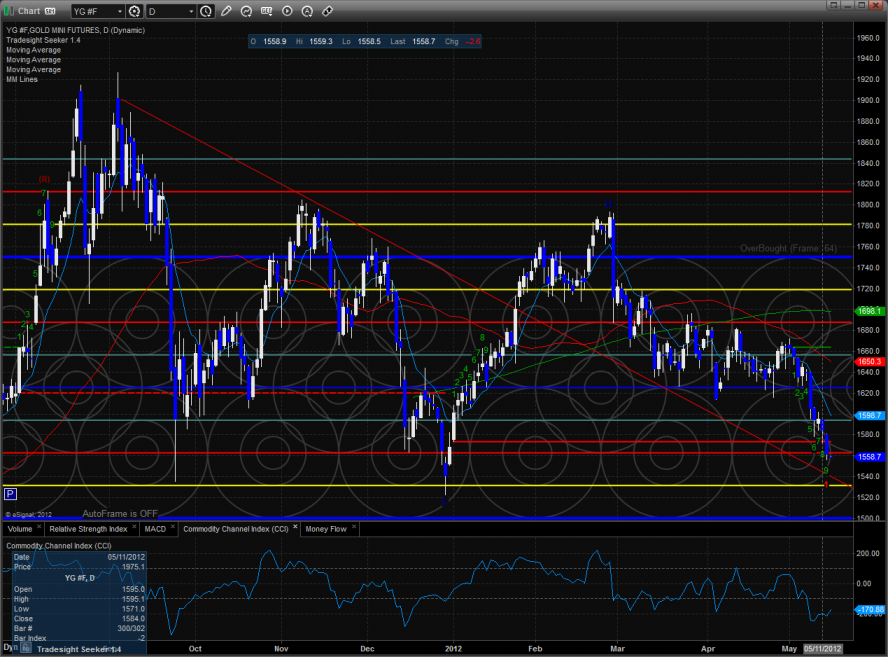
Gold is 9 days down:
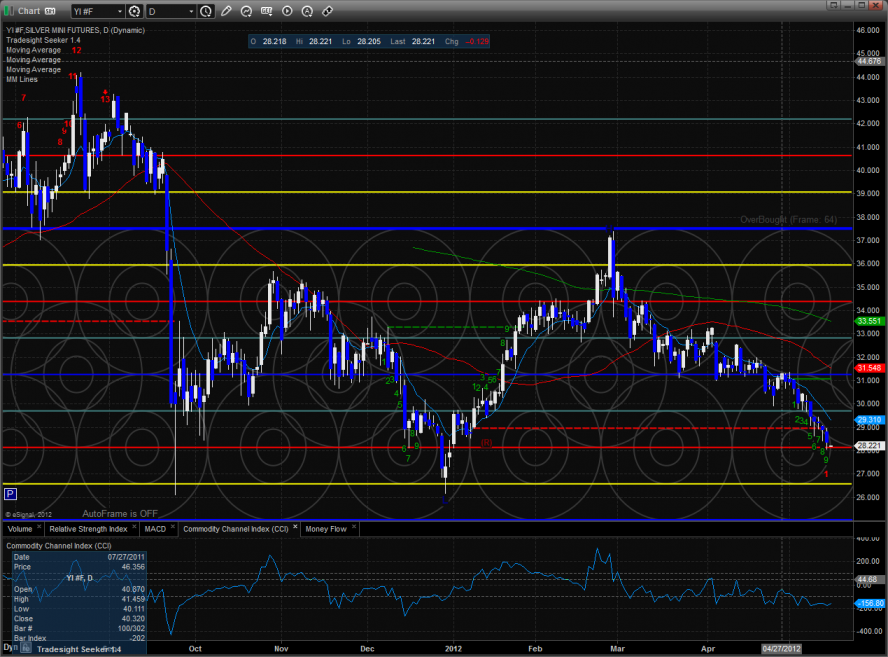
Silver is also 9 days down:
Tradesight Market Preview for 5/15/12
May 14, 2012
|In Tradesight
Tradesight Market Preview for 5/15/12
May 14, 2012
|In Tradesight
The ES lost 16 handles on the day making a new low on the move. Price undercut the key 2 bar island made in early March and has qualified the lower high set in late April. The Seeker count is now 8 days down so the broad market could see a bounce later this week.
The NQ futures made a new low close on the move. Price is below all the important major moving averages and is in a short-term down trend. Like the ES, the NQ futures are 8 days down so either a lateral move or bounce is on deck. Note how the early March lows are key support.
The 10-day Trin is still hovering around the oversold threshold.
The total put/call ratio remains neutral.
Multi sector daily chart:
All of the major moving averages were red on the day with the BTK being the strongest. It was in insicde day but net another accumulation session with price closing above the open.
The short term oversold SOX was stronger than the broad market one the day. Keep a close eye on the 200dma and the lower trend channel which together are key support.
The OSX made a new low on the move and is now 9 days down on the Seeker count.
The BKX was hit hard and much weaker than the broad market. The pattern is now 9 days down and just above key support at the static trend line.
The XAU recorded its first close below the Seeker risk level. A new intraday low would nullify the buy signal though it’s unlikely in the next 48 hours because of the new 9 bar setup that just completed.
Oil:
Gold is 9 days down:
Silver is also 9 days down: