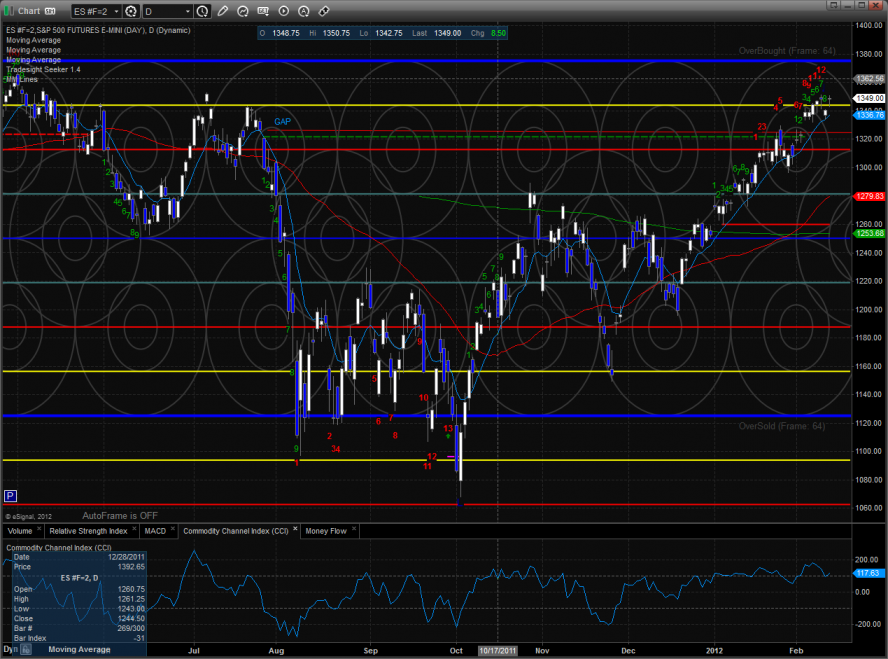
The ES was higher by 8 on the day which is technically very significant. This will produce the final candle of the active 9 bar Seeker setup. In so doing it will recycle the countdown and defer it to the newly completed setup.
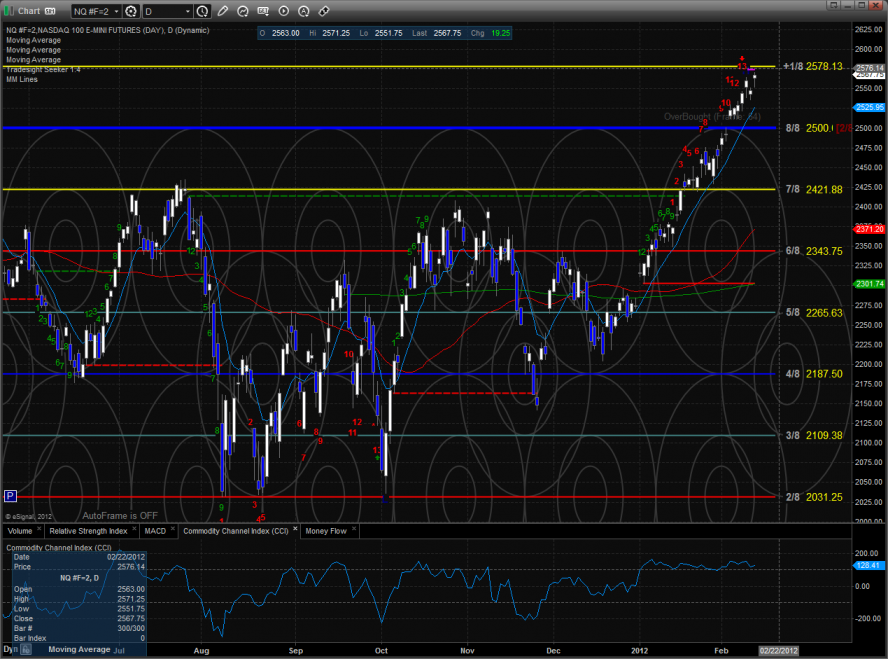
The NQ futures made a new high on the move by gaining 19 on the day. The Seeker sell signal is still active until the risk level is broken. Keep a close eye on the +1/8 overbought level.
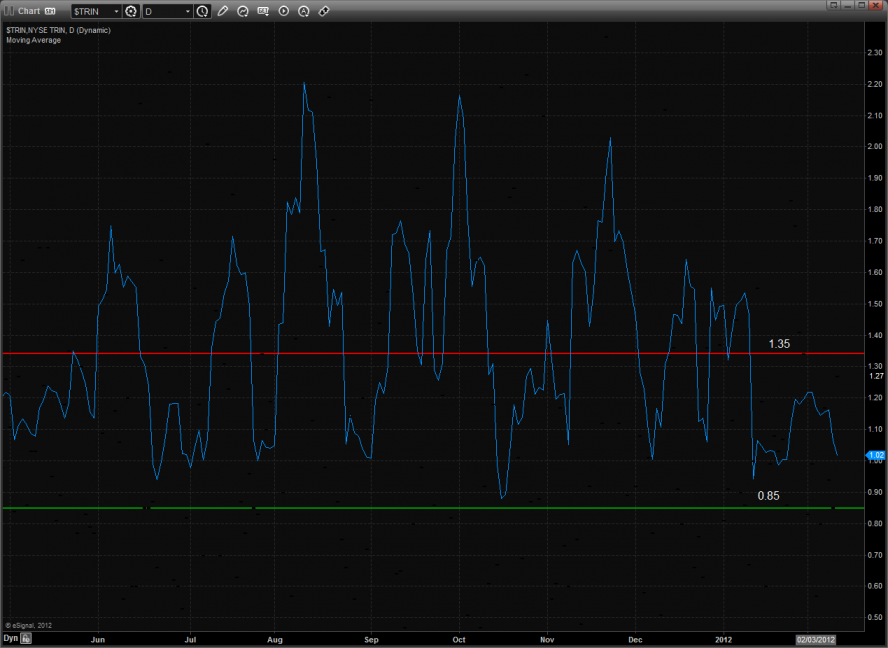
The 10-day Trin remains above the overbought threshold of 0.85.
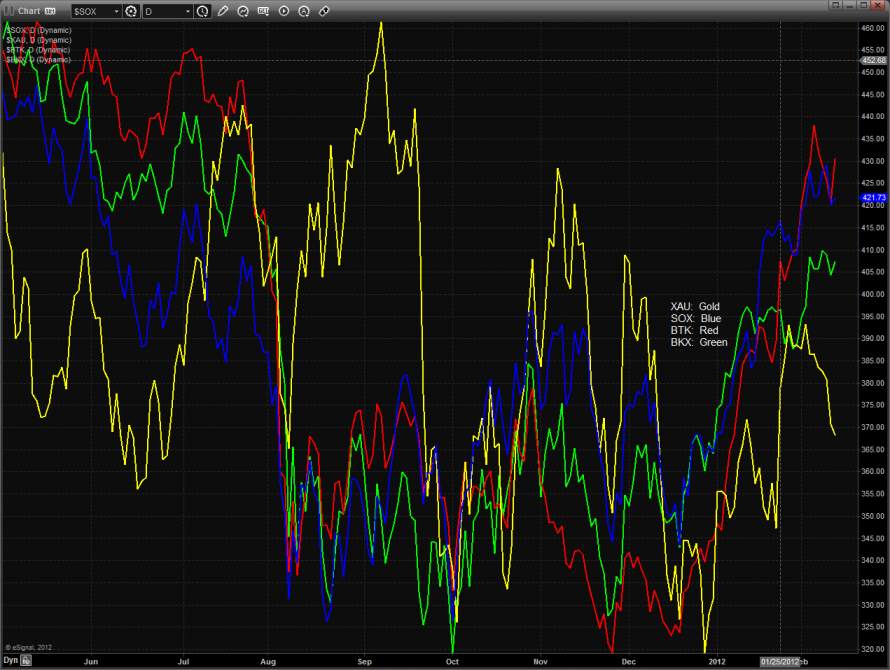
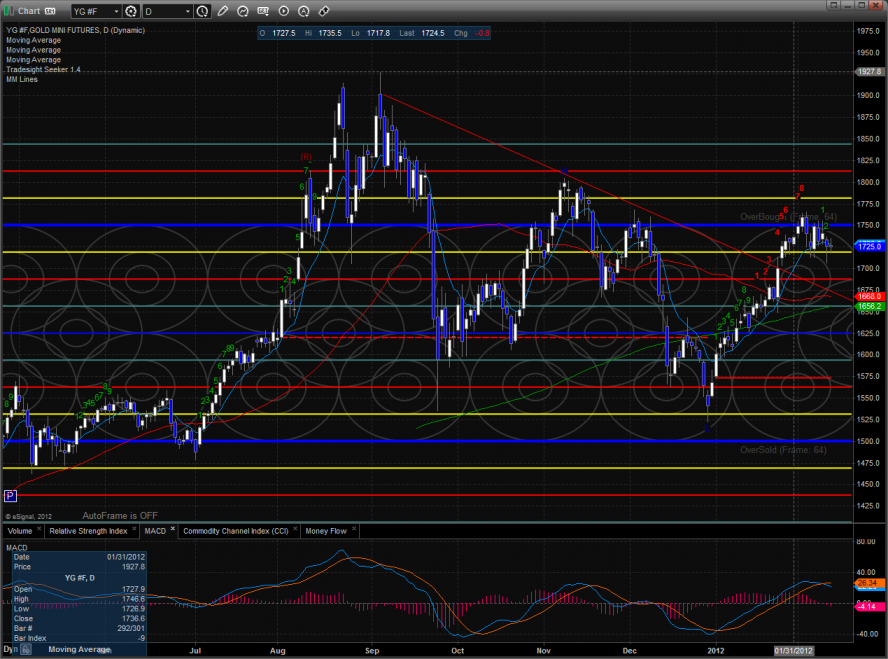
Multi sector daily chart shows that the XAU continues to be a source of funds.
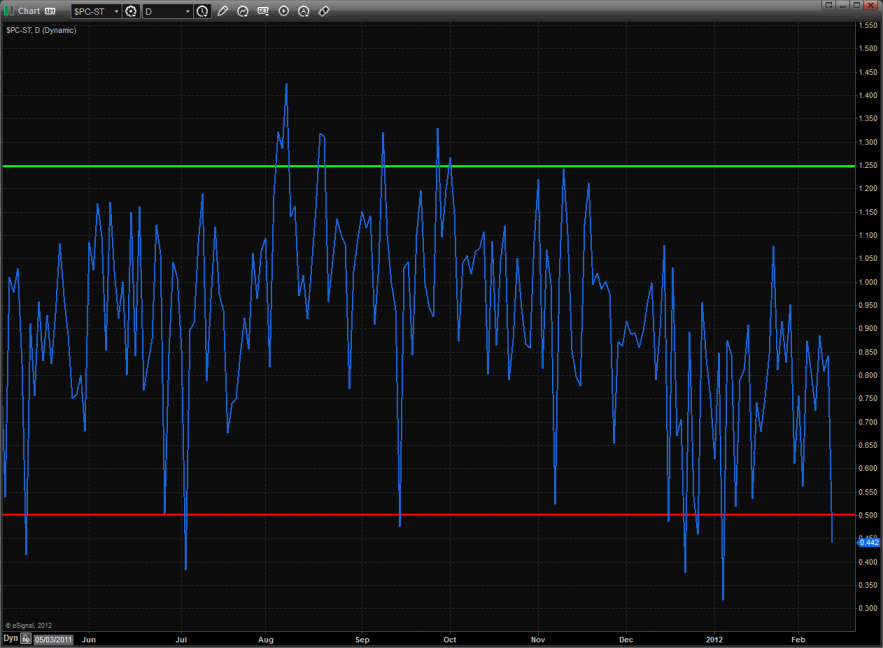
This is the important chart for the next couple of days. The total put/call ratio recorded a climatically low reading. The market will typically have a violent selling episode in the next 1-3 trading day. Once it begins and the intraday market internals confirm play the short side only and avoid buying the breaks which will be treacherous.
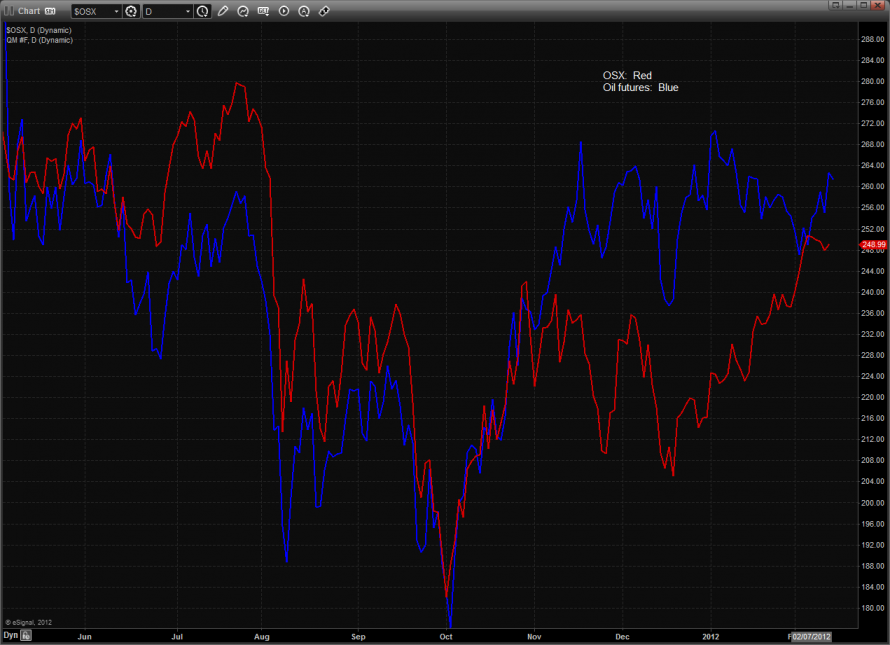
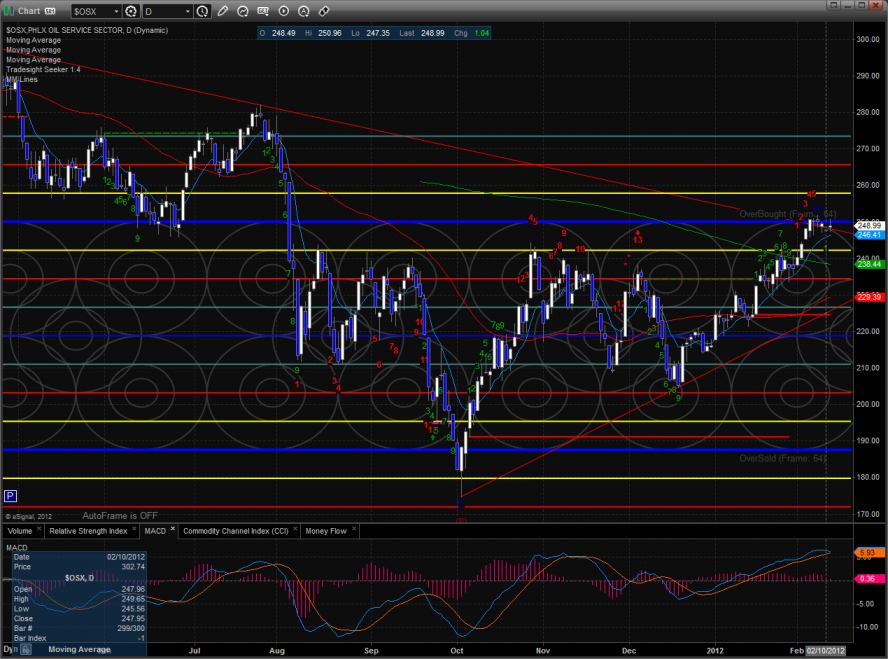
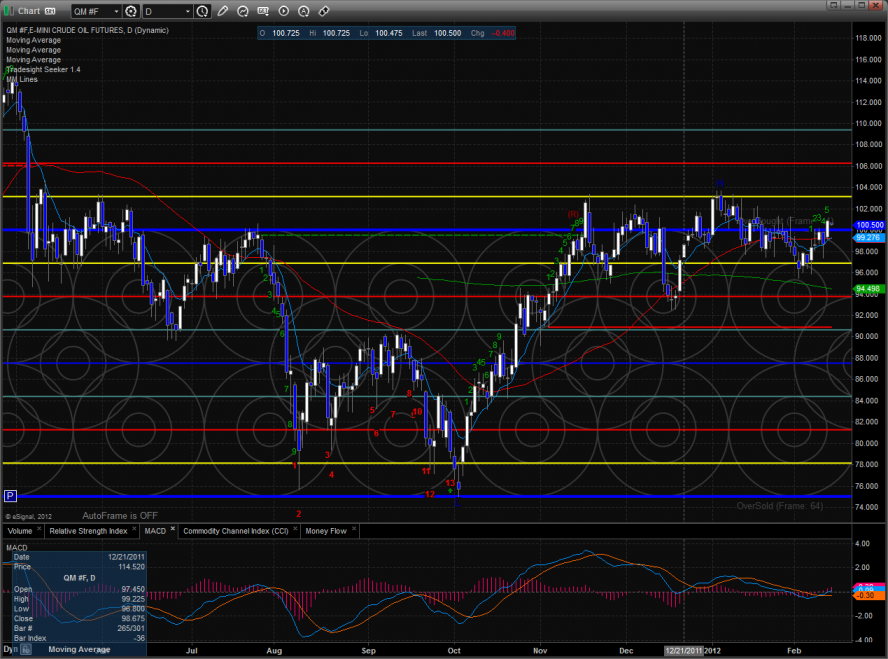
The OSX has begun to underperform the underlying oil futures. If oil breaks to the downside there could be limited support until more meaningful levels are traded.
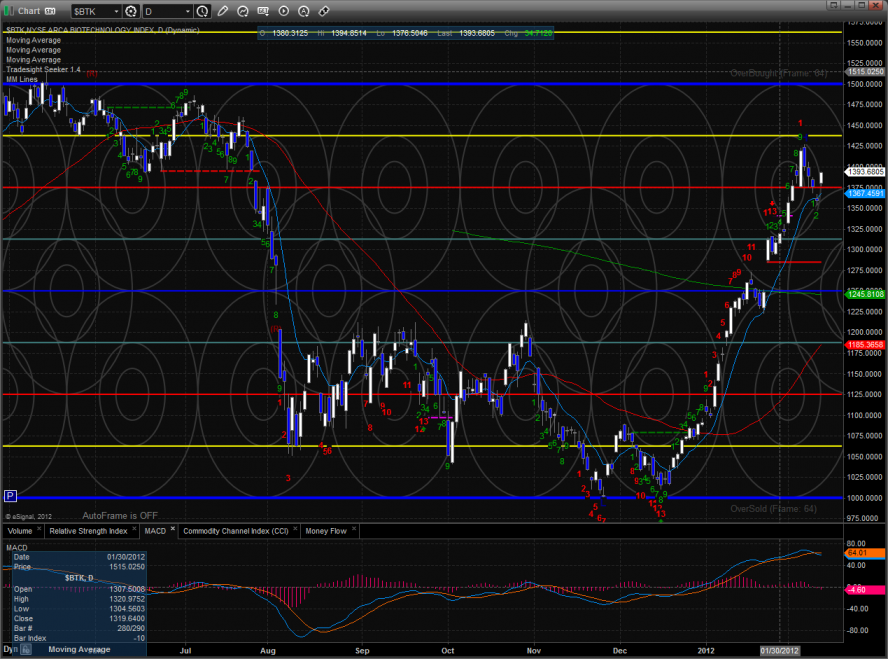
The BTK was the top sector on the day but beware that it may only be a bounce. Keep a close eye on the MACD which is now rolling over.
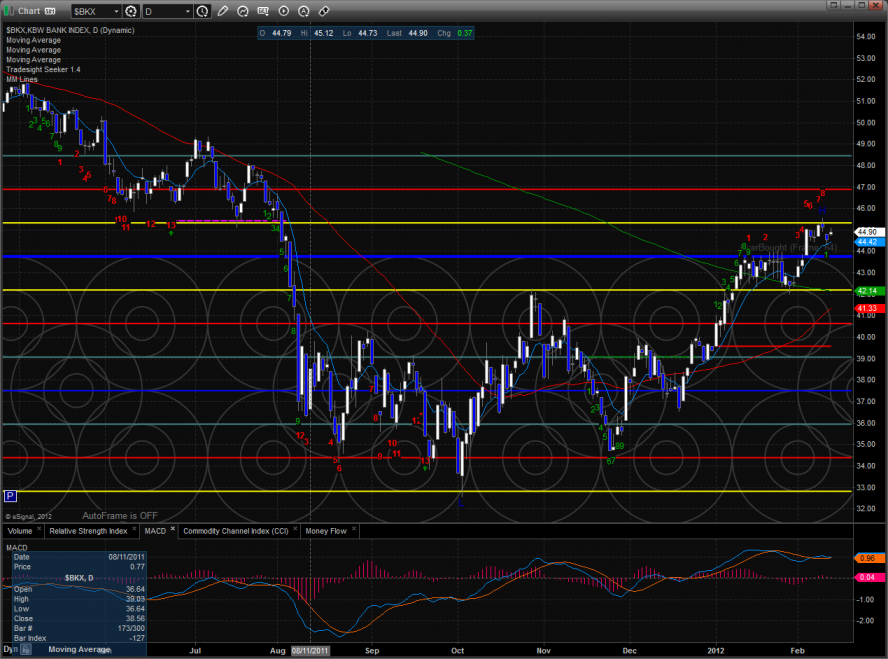
The BKX was stronger than the broad market. But remains overbought with a Seeker count that is 8 days up.
The OSX is still gaming the upper boundary of the active pattern. Price remains below the 8/8 level.
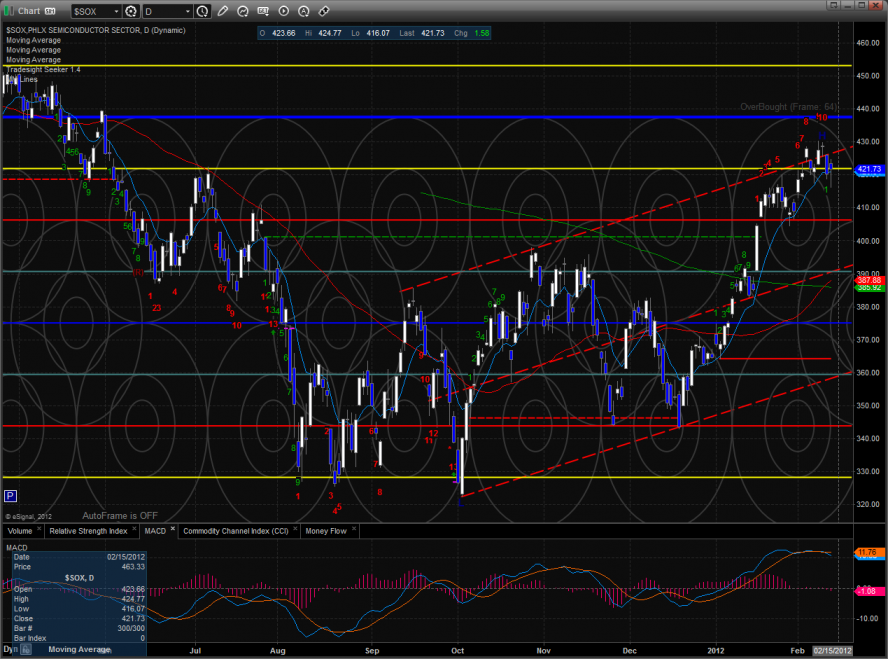
The SOX underperformed the NAZ which is cause for concern. Be on guard for the breadth narrowing in the NDX where mumbles like AAPL are asked to do too much to hold up the advance. The MACD continues to deteriorate.
Oil:
Gold:
Tradesight Market Preview for 2/14/12
February 13, 2012
|In Tradesight
Tradesight Market Preview for 2/14/12
February 13, 2012
|In Tradesight
The ES was higher by 8 on the day which is technically very significant. This will produce the final candle of the active 9 bar Seeker setup. In so doing it will recycle the countdown and defer it to the newly completed setup.
The NQ futures made a new high on the move by gaining 19 on the day. The Seeker sell signal is still active until the risk level is broken. Keep a close eye on the +1/8 overbought level.
The 10-day Trin remains above the overbought threshold of 0.85.
Multi sector daily chart shows that the XAU continues to be a source of funds.
This is the important chart for the next couple of days. The total put/call ratio recorded a climatically low reading. The market will typically have a violent selling episode in the next 1-3 trading day. Once it begins and the intraday market internals confirm play the short side only and avoid buying the breaks which will be treacherous.
The OSX has begun to underperform the underlying oil futures. If oil breaks to the downside there could be limited support until more meaningful levels are traded.
The BTK was the top sector on the day but beware that it may only be a bounce. Keep a close eye on the MACD which is now rolling over.
The BKX was stronger than the broad market. But remains overbought with a Seeker count that is 8 days up.
The OSX is still gaming the upper boundary of the active pattern. Price remains below the 8/8 level.
The SOX underperformed the NAZ which is cause for concern. Be on guard for the breadth narrowing in the NDX where mumbles like AAPL are asked to do too much to hold up the advance. The MACD continues to deteriorate.
Oil:
Gold: