The ES was lower by 12 on the day, expanding the downside range in the process. Price closed very close to the round 1200 price. Note that the pattern is now 8 days down and the gap from 11/29 is filled. This doesn’t happen very often but like the ES being 8 days down, there are 1362 stocks 8 days down which implies that either an arrest of the down trend or bounce is close at hand.

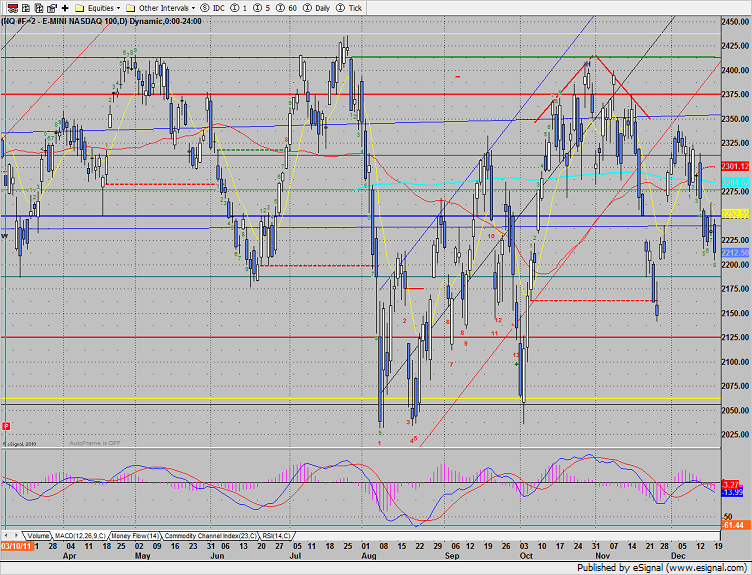
The NQ futures were lower by 20 on the day. This is a new low on the move and the 8th day down. The gap window at 2205 is still key support.
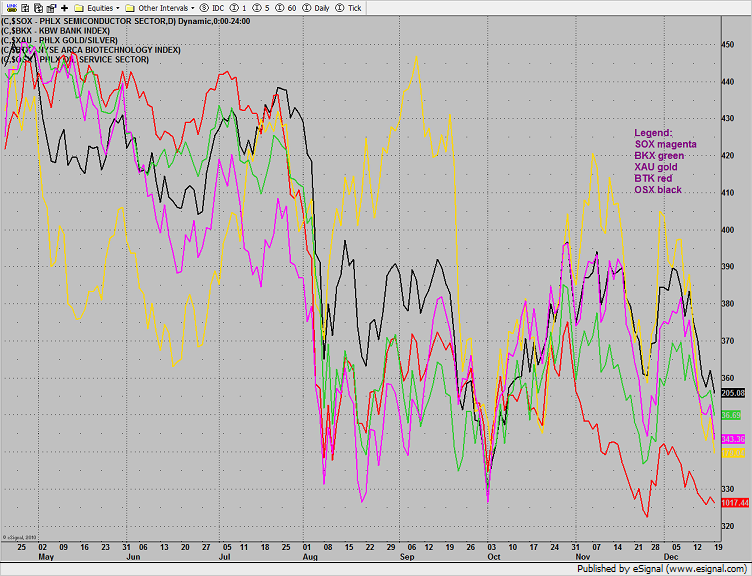
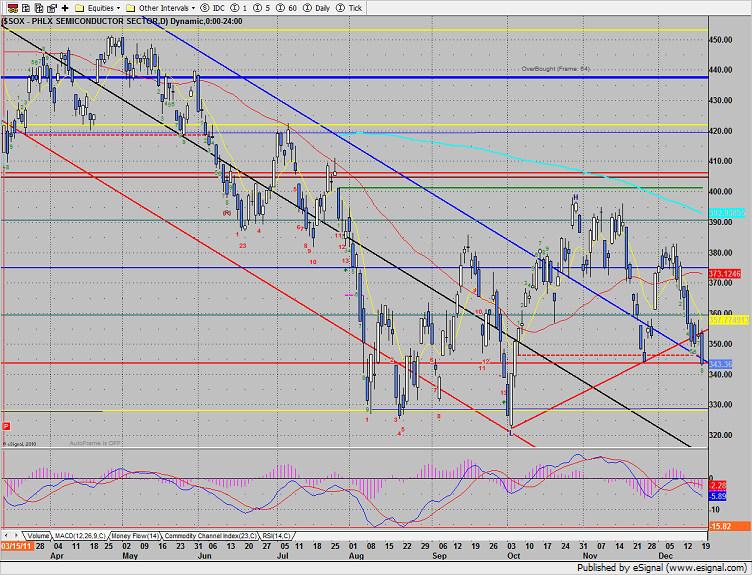
Multi sector daily chart:
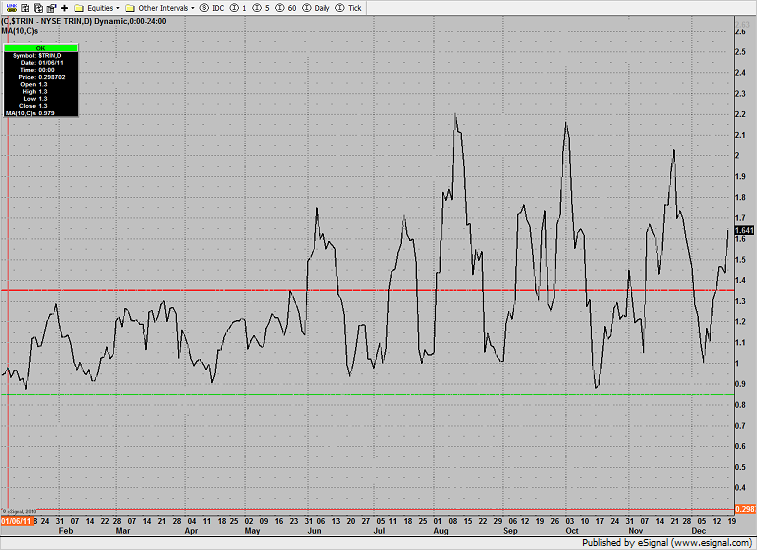
The 10-day Trin continues to climb and get more oversold. This is fuel in the tank for a reversal off the 1300+ stocks 8 days down.
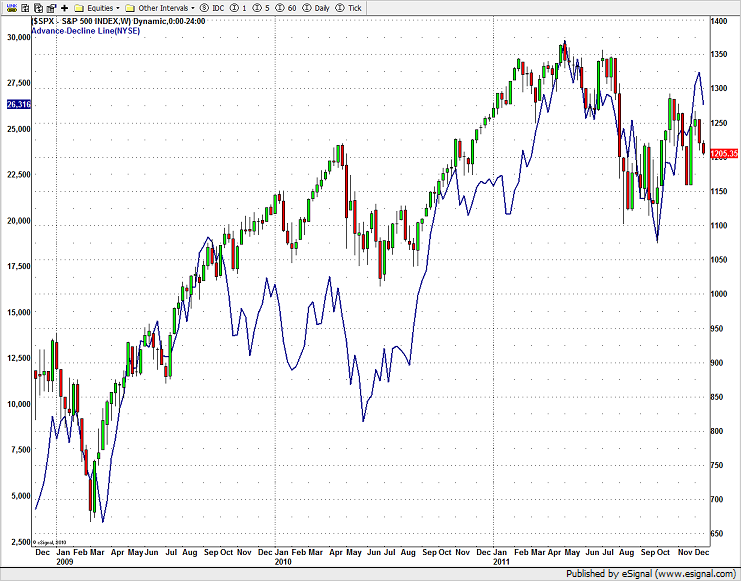
The NYSE cumulative A/D line remains healthy and leading price:
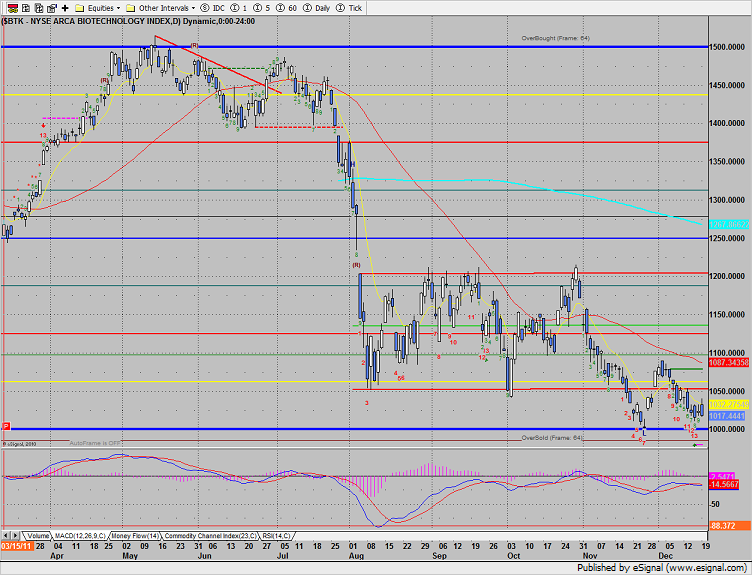
The BTK was the top gun on the day or the “best of the worst”. The Seeker buy signal is still active.
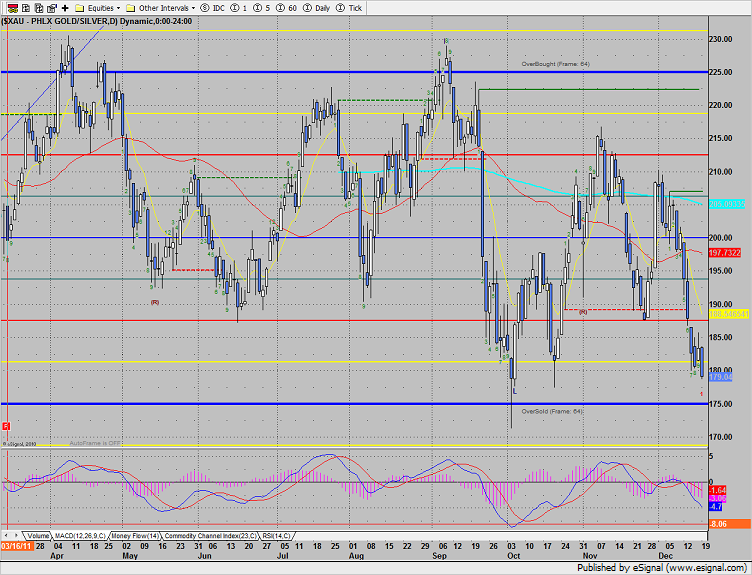
The XAU matched the low close of the year–key support at 175.
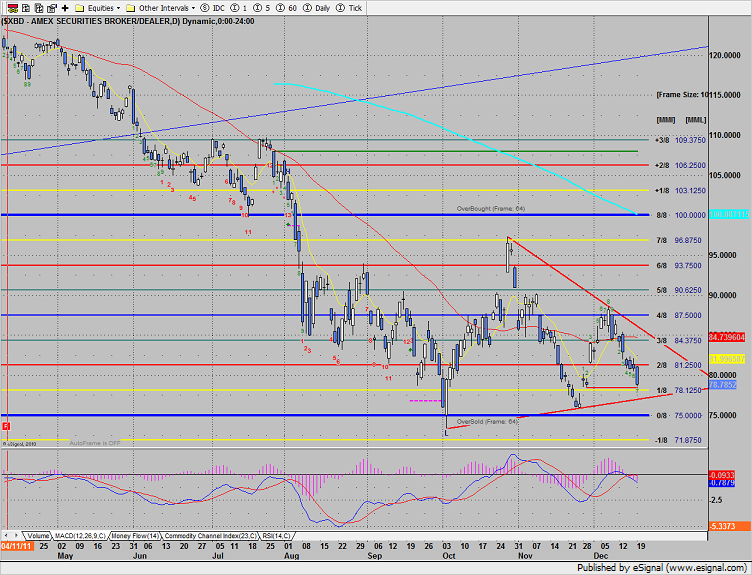
The broker-dealer index is getting close to the lower boundary of the active pattern. Price is right at support from the active static trend line.
The OSX was weaker than the broad market and is now 9 days down.
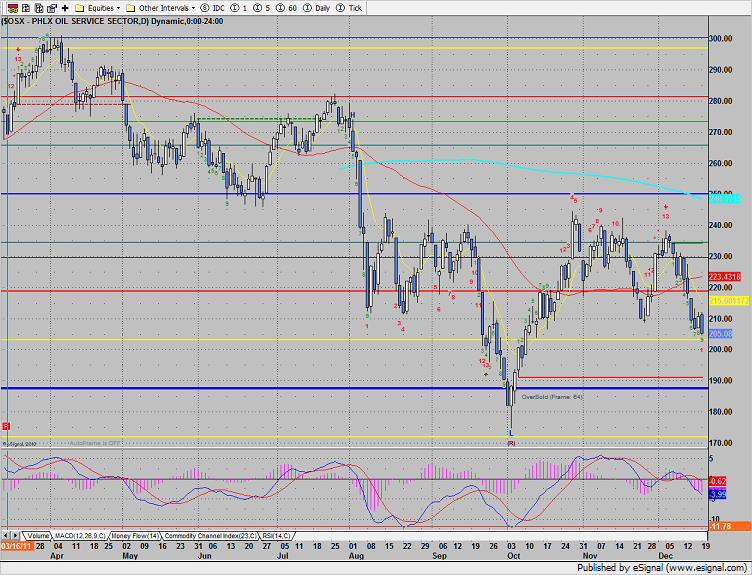
The SOX was weaker than the Naz and SP and is now 8 days down.
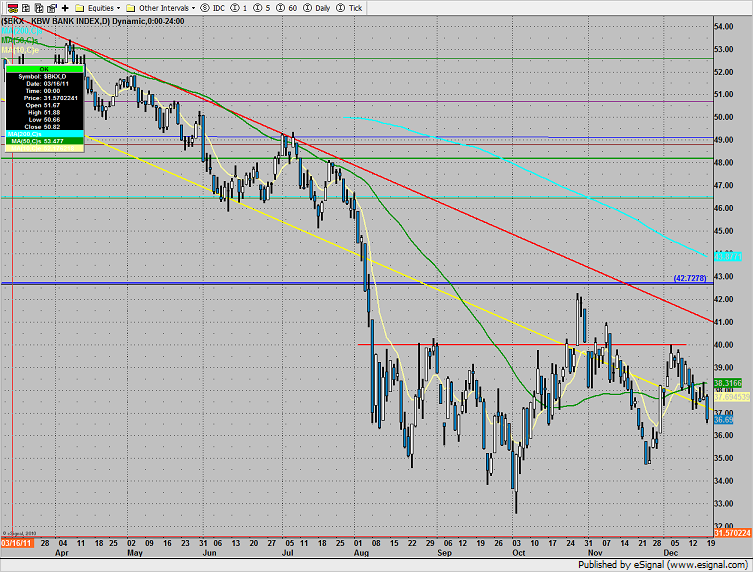
The BKX was the last laggard on the day and remains below all major moving averages.
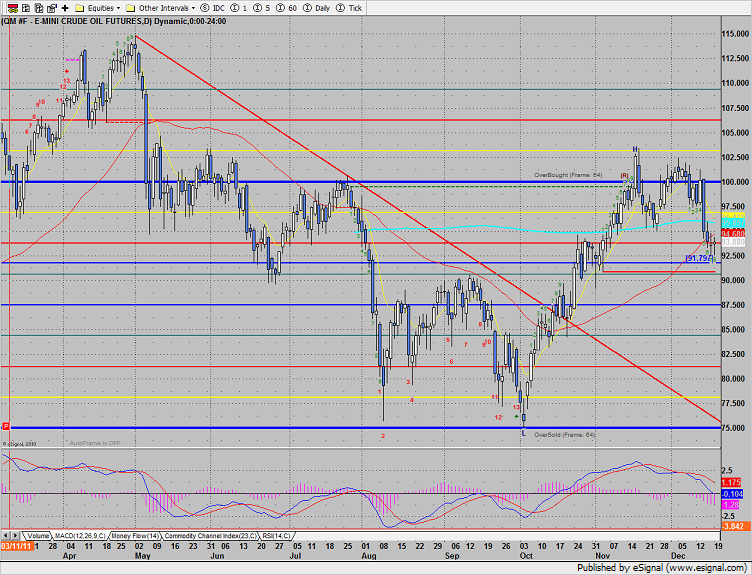
Oil traded in a range and did little vs. Friday’s settlement.
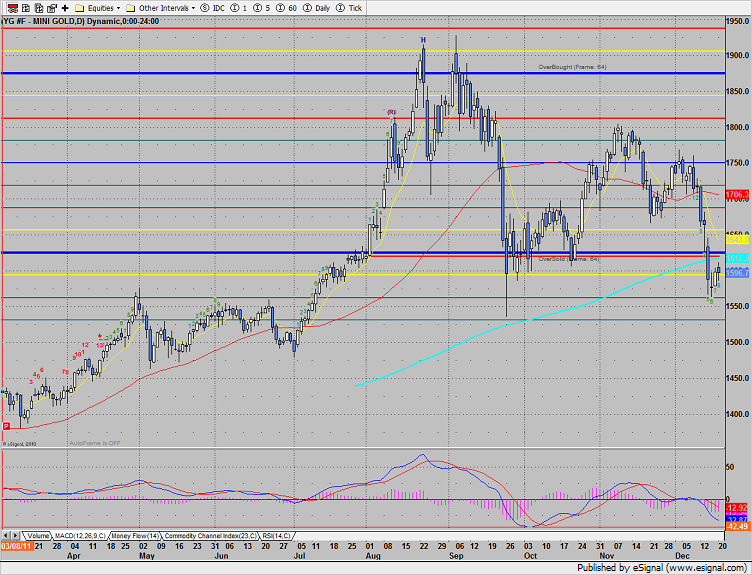
Gold bounced but is still below the 200dma.
Tradesight Market Preview for 12/20/11
December 19, 2011
|In Tradesight