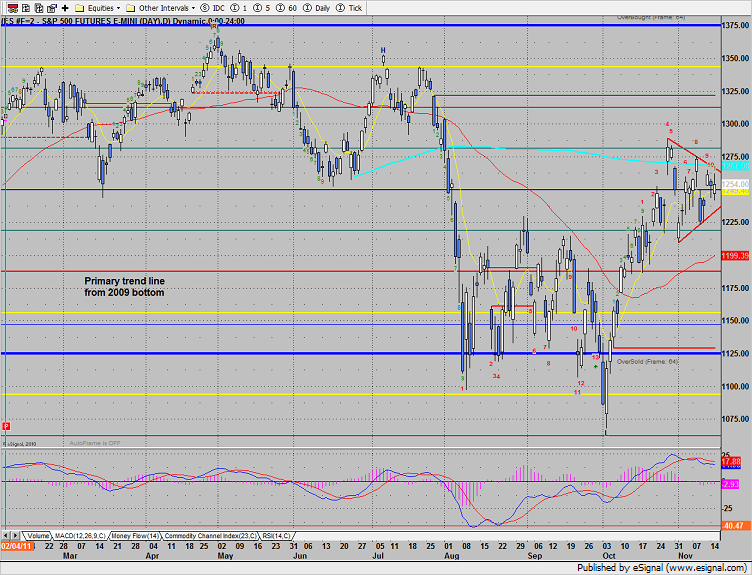
The ES reversed back to the upside but is still trapped under the 200dma and within the triangle pattern. The pattern needs to be resolved before there is any new technical development.
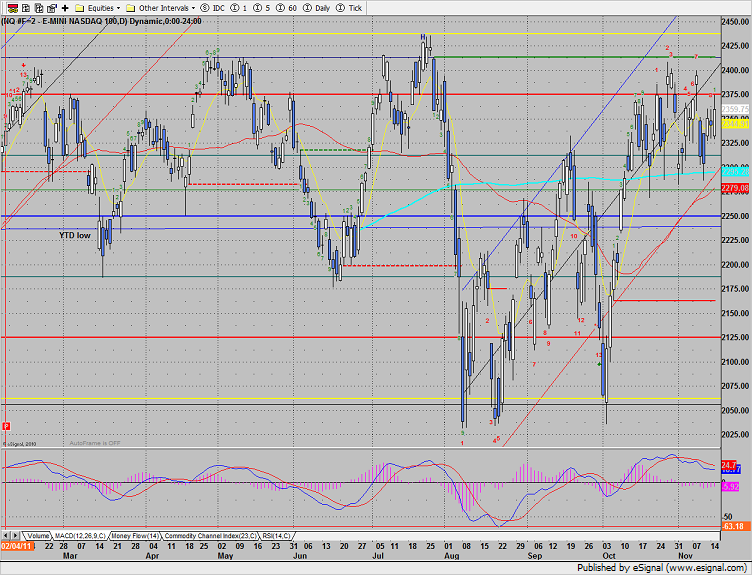
The NQ futures were higher by 17 on the day besting the range from the last few days. The MACD remains negative but so far price remains bullishly above the 200dma.
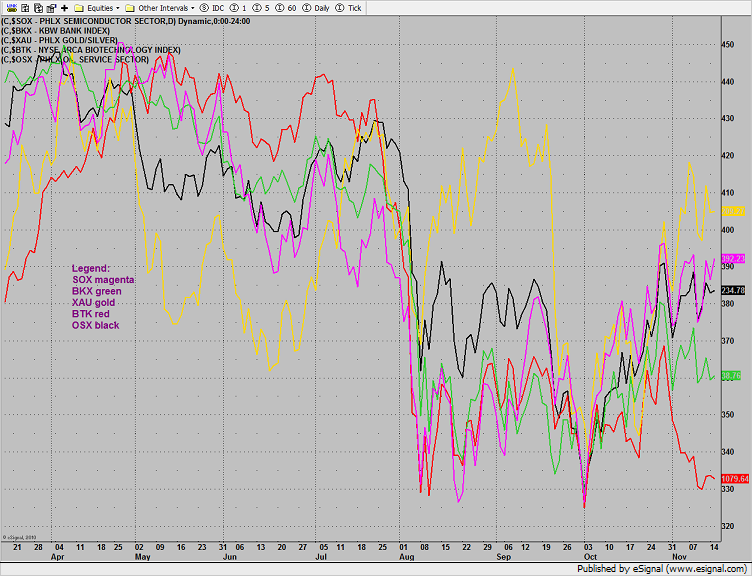
Multi sector daily chart:
Intermarket analysis:
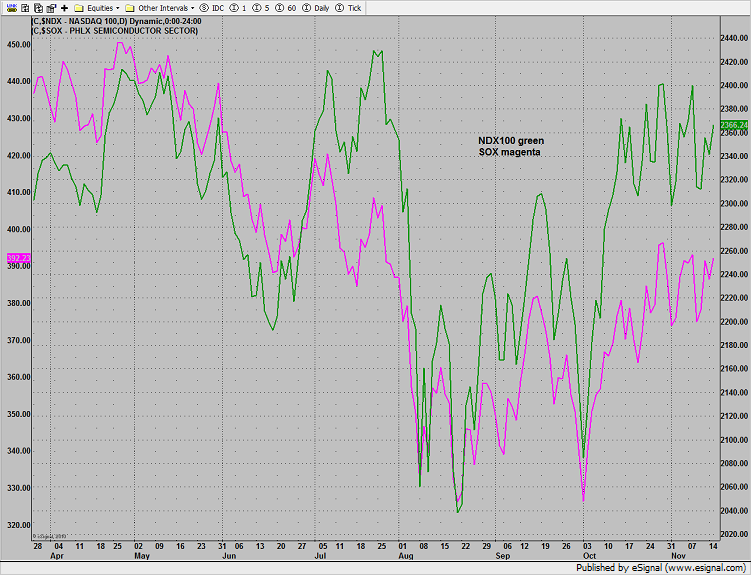
The NDX is still bullishly leading the SPX.
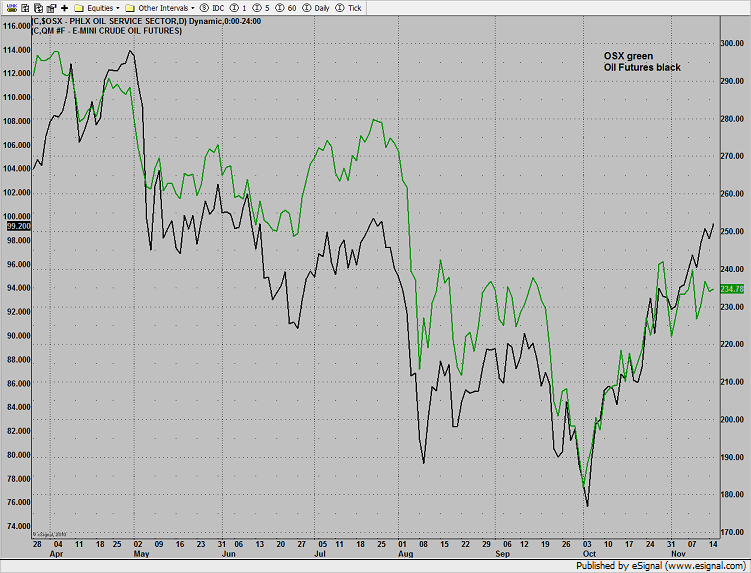
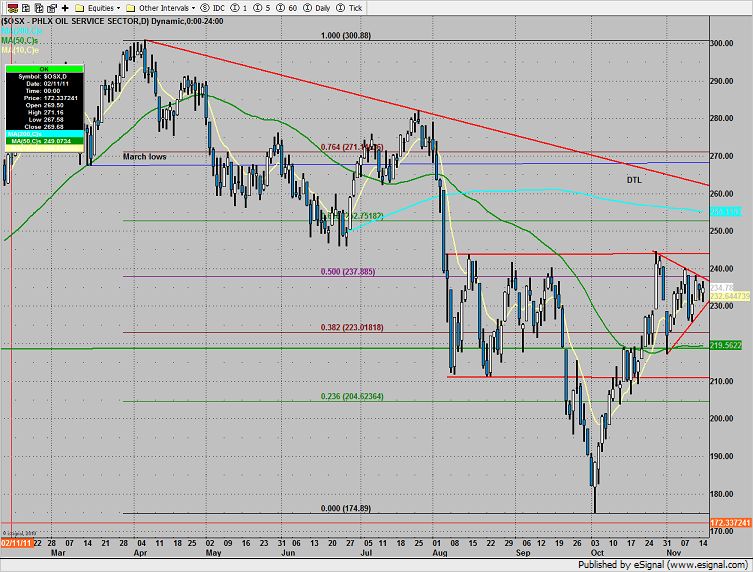
Oil service stocks represented by the OSX are bearishly lagging oil futures. This implies that when oil hits the next level of resistance, it will fail.
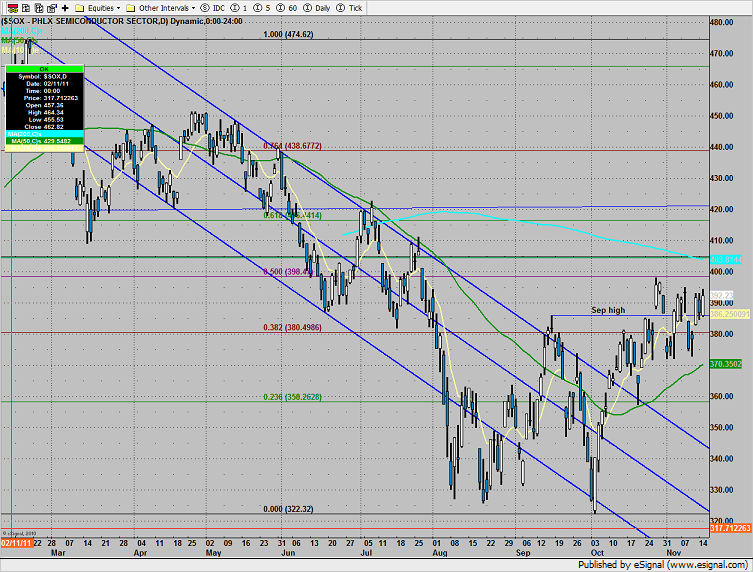
The SOX is badly lagging the NDX and will be a drag until the relationship normalizes.
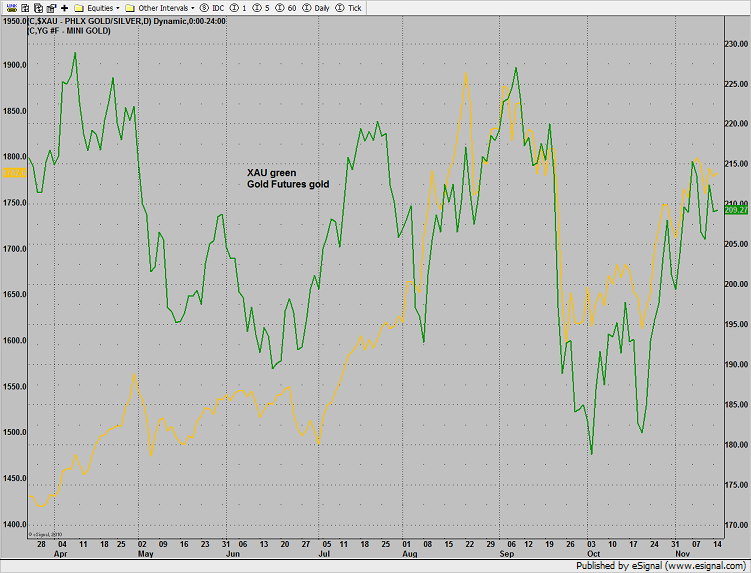
The XAU is slightly lagging gold futures but the divergence is very minimal. Keep a close eye on the chart to see if the divergence widens which would be bearish for the underlying commodity.
The SOX was top gun on the day, leading all other major sectors. The break over the 50% fib is the key to much higher prices and an overall positive NDX. Although not denoted on this chart, the current pattern is 10 days up in the Seeker sell countdown with little chance of a recycle.
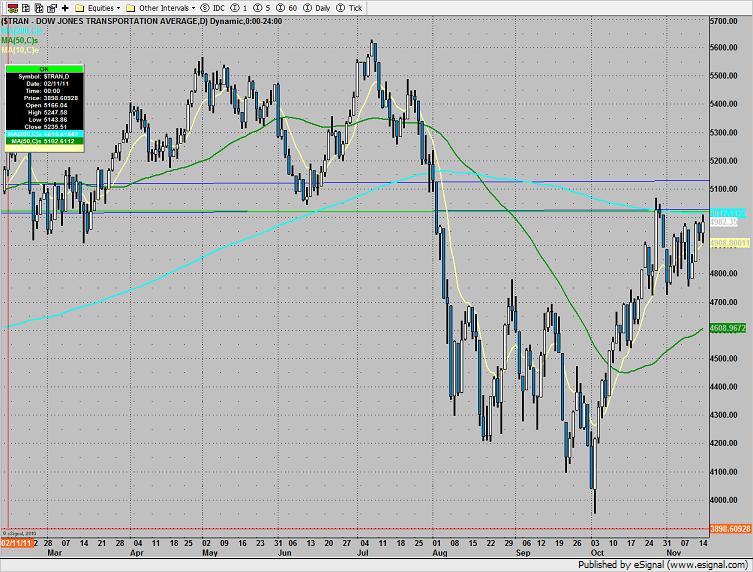
The Dow transports are back again to challenge the 200dma. Dow theorists are watching this very closely.
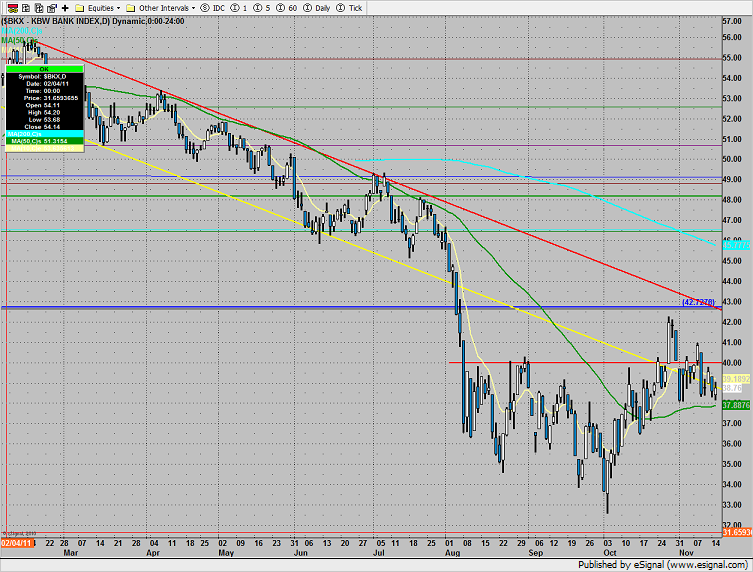
The BKX was higher on the day and traded in-line with the performance of the broad market. Key support just below at the 50dma
The OSX closed little changed on the day. Like the broad market, the OSX is winding up inside a triangle.
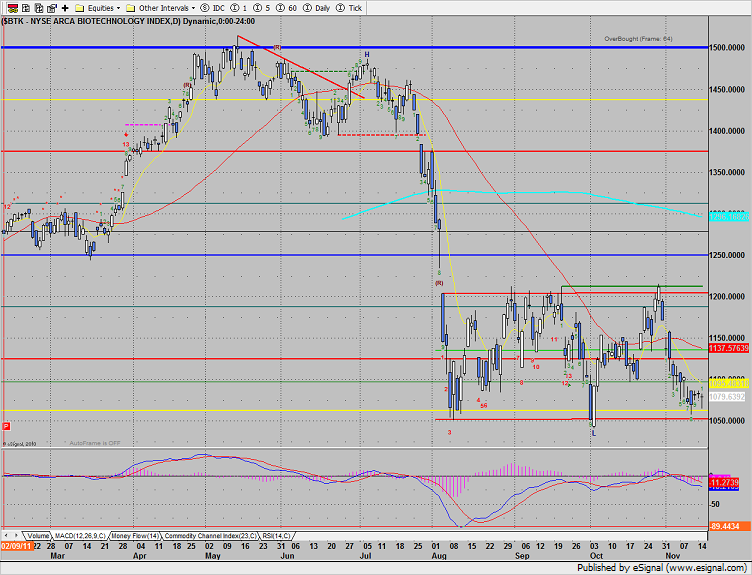
Keep a close eye on the BTK for a break back above the 1088 level which will could turn initiate a Seeker price flip and pivot the trend off the 9 bars down.
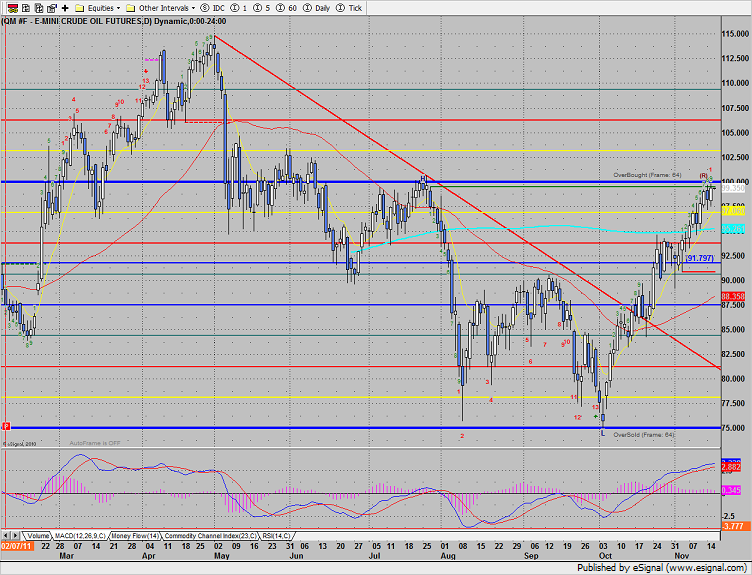
Oil is now 9 day up and into the static trend line. This is key resistance and a huge level.
Tradesight Market Preview for 11/16/11
November 15, 2011
|In Tradesight