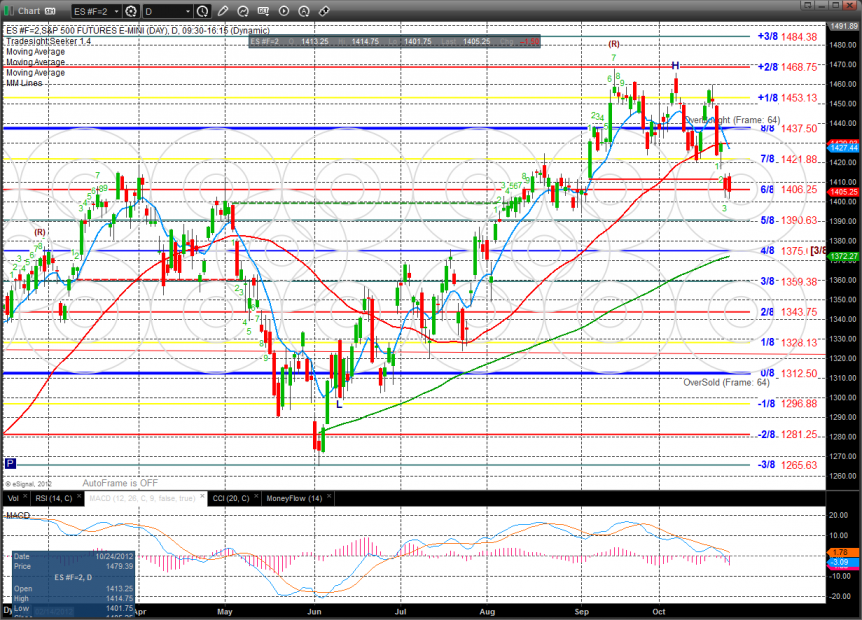
The ES logged a pretty flat day but expanded the downside range and made a second close below the static trend line which will now break it. Key support remains at 1406.
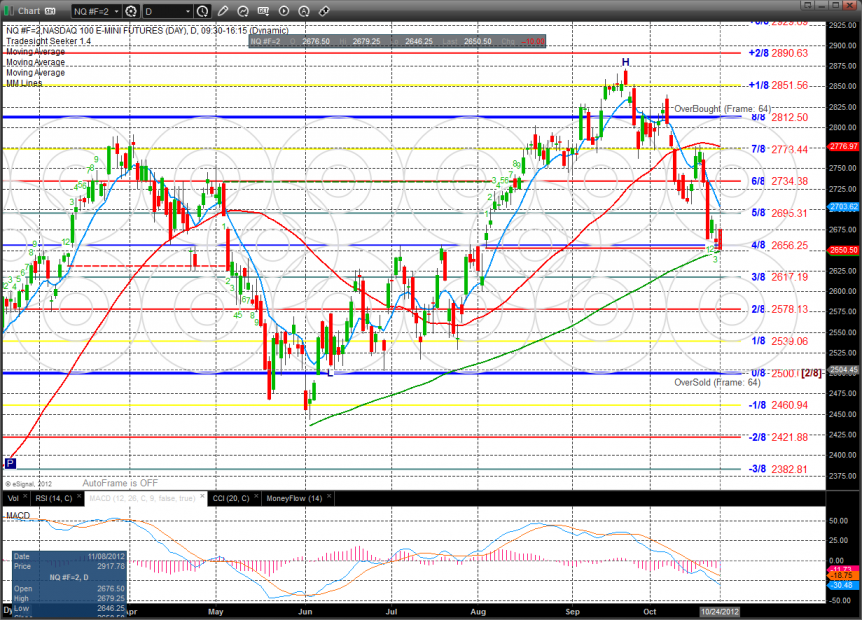
The NQ futures were lower by 10 on the day settling right at the key 200dma. Keep in mind that the 200dma tends to get gamed when first tested so be prepared.
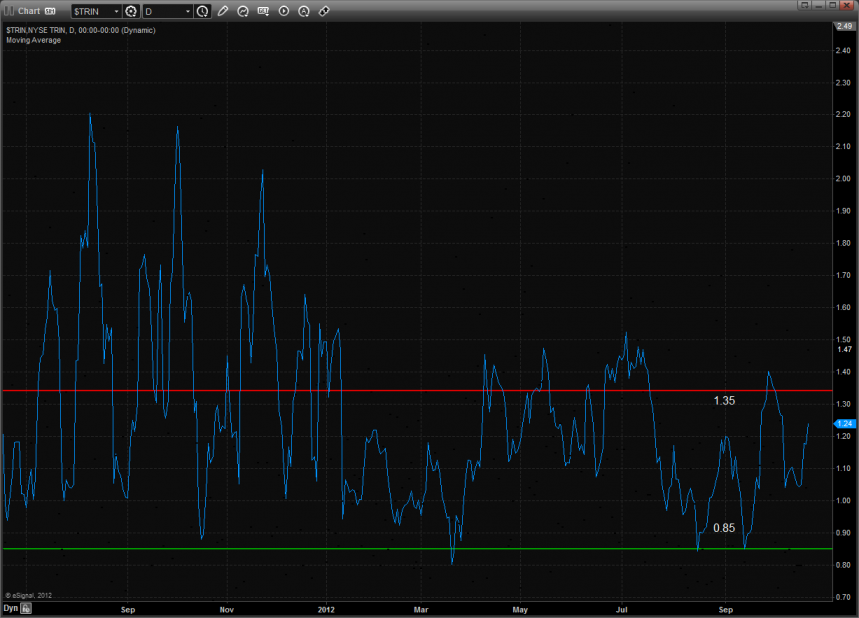
The 10-day Trin is still carrying oversold energy.
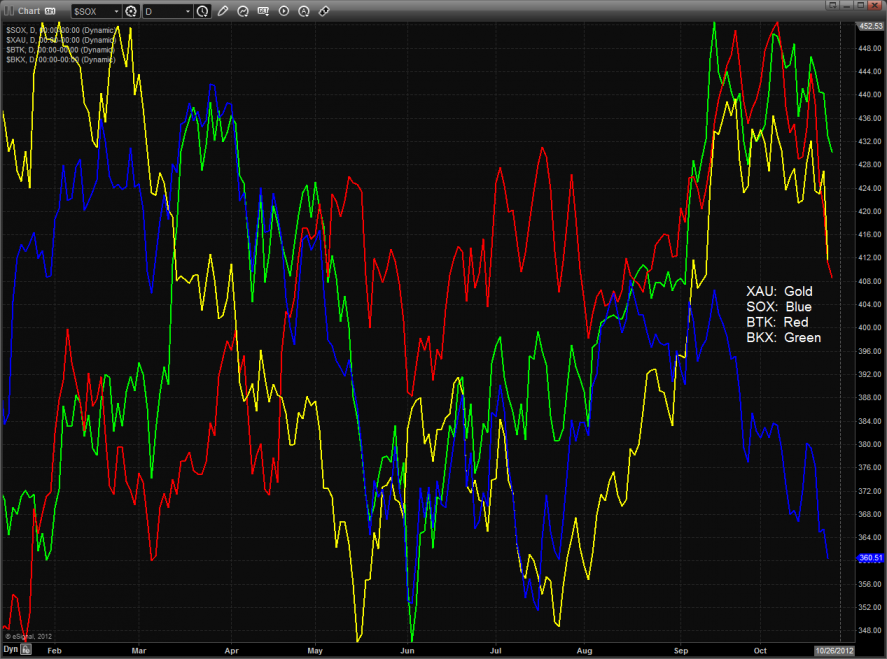
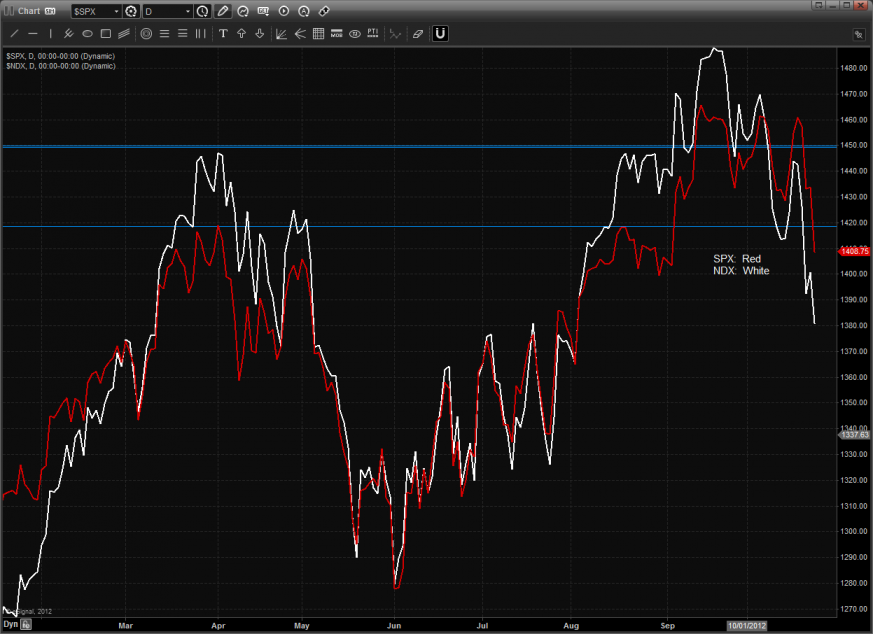
Multi sector daily chart:
The NDX vs. SPX shows the troublesome relative weakness in the NDX. There is some separation in the chart and traders should be prepared for a window where the SPX has some relative weakness while the Naz side uses the 200dma for support. This won’t change anything but after this window closes then the relative behavior again becomes front and center.
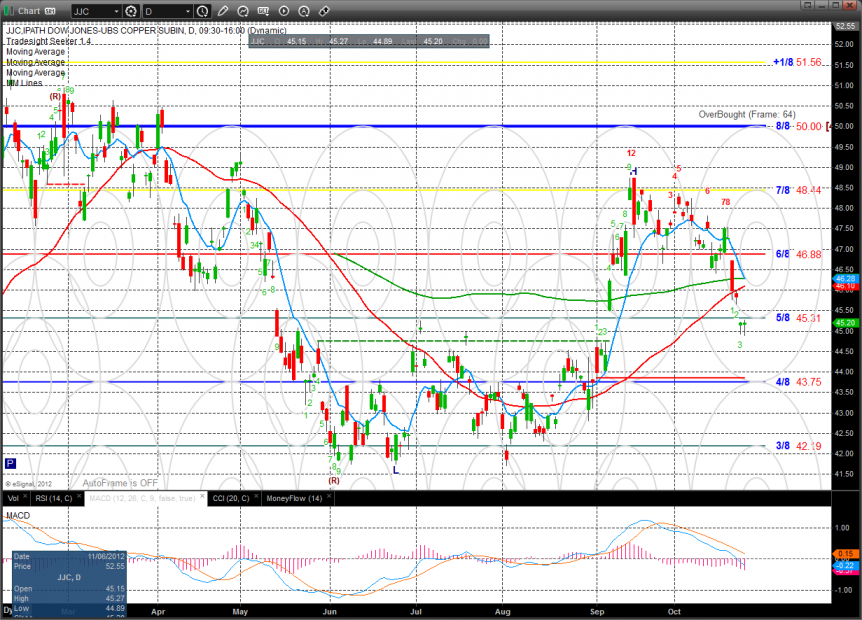
Copper, affectionately known as the PhD of commodities, has broken decisively below all major moving averages. In the chart of the copper tracking JJC etf, there is now no noticeable support until the Seeker static trend line at 43.75. Careful examination of the chart patter will show a multi month island in place.
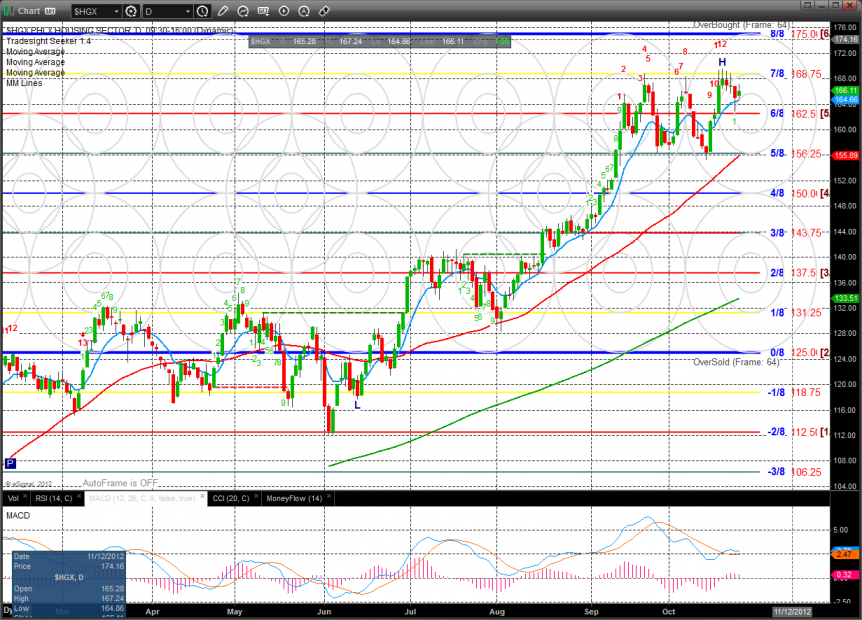
The HGX housing index was the top gun on the day. The pattern has had a very nice run and is only one strong day away from a Seeker 13 exhaustion signal.
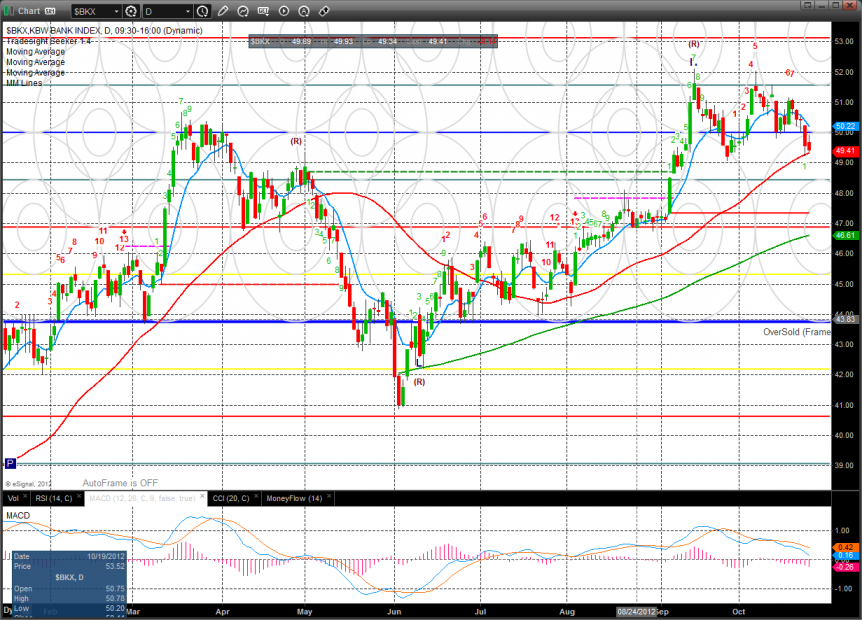
The BKX was lower on the day but outperformed the NDX. Price has yet to violate the Sep low and the 50dma—this is the key area.
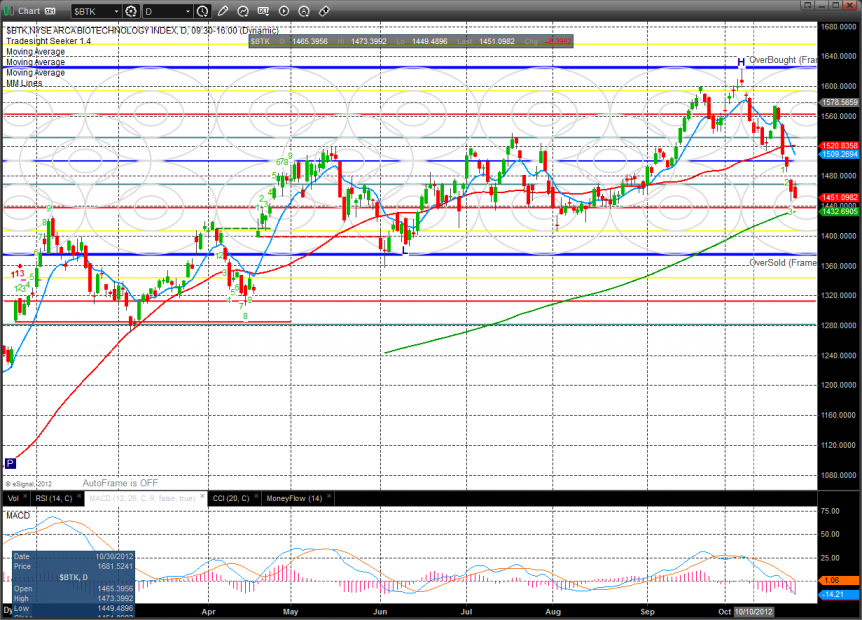
The BTK is breaking with the 200dma in sight. Note that the MACD is in a very bearish position with downside momentum gathering.
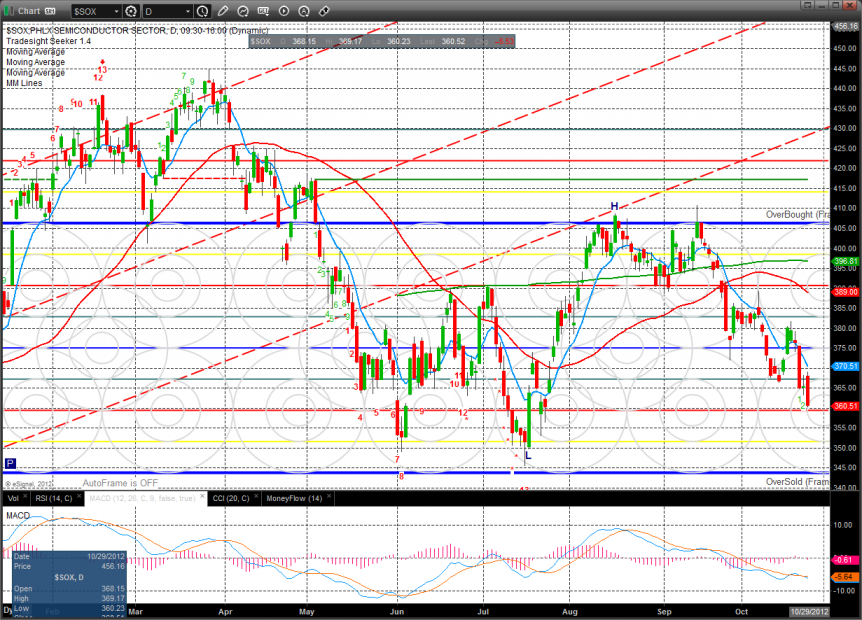
The SOX index has bearishly made a new low on the move asd is now to the last real area of support before the prior lows.
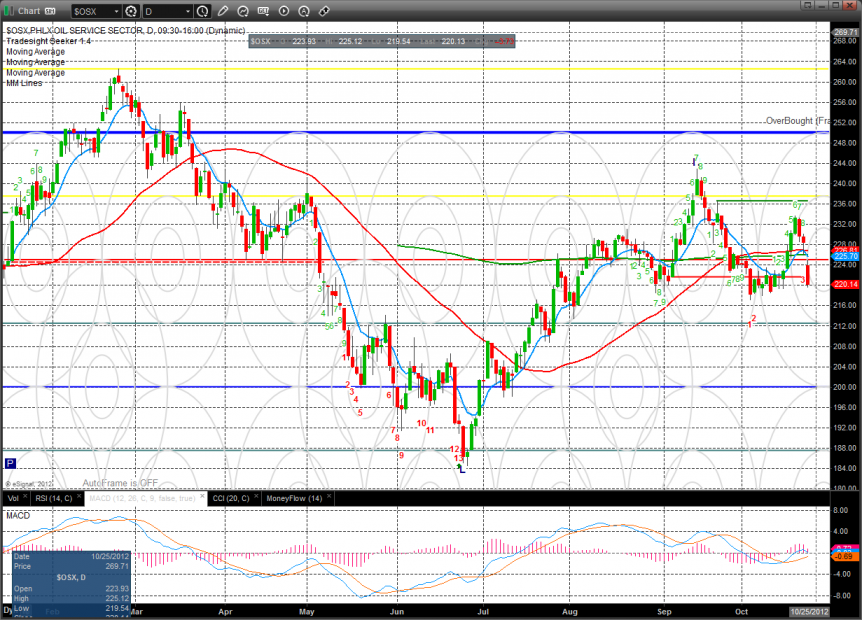
The OSX was weaker than the broad market and is back down to key support.
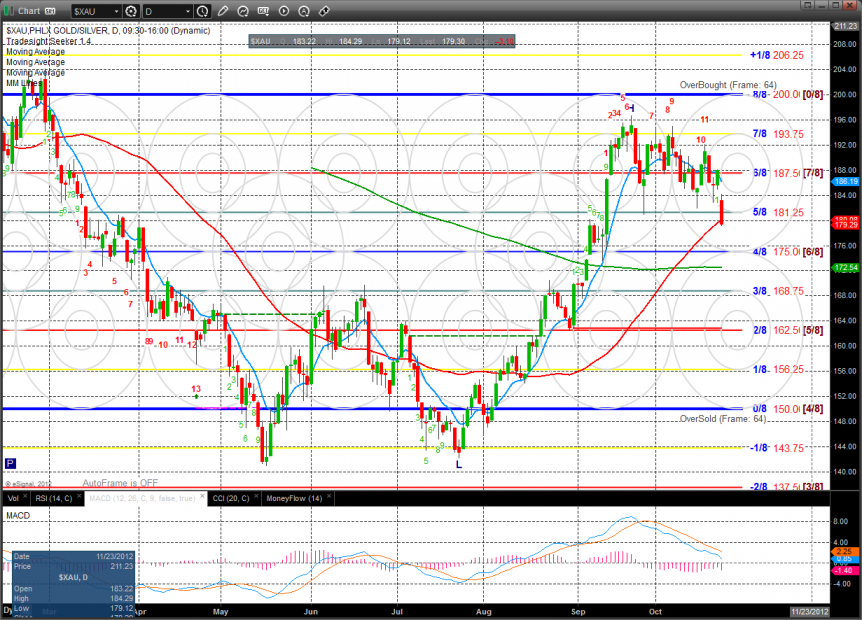
The XAU was the last laggard and has settled below the low of the recent trading range. Keep a close eye on the key 175, 4/8 level for the next area of support.
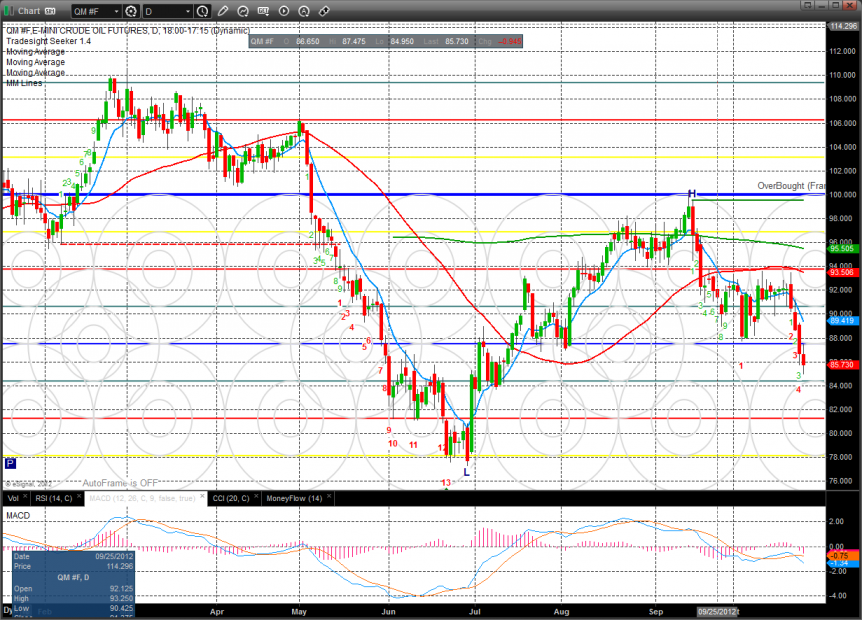
Oil:
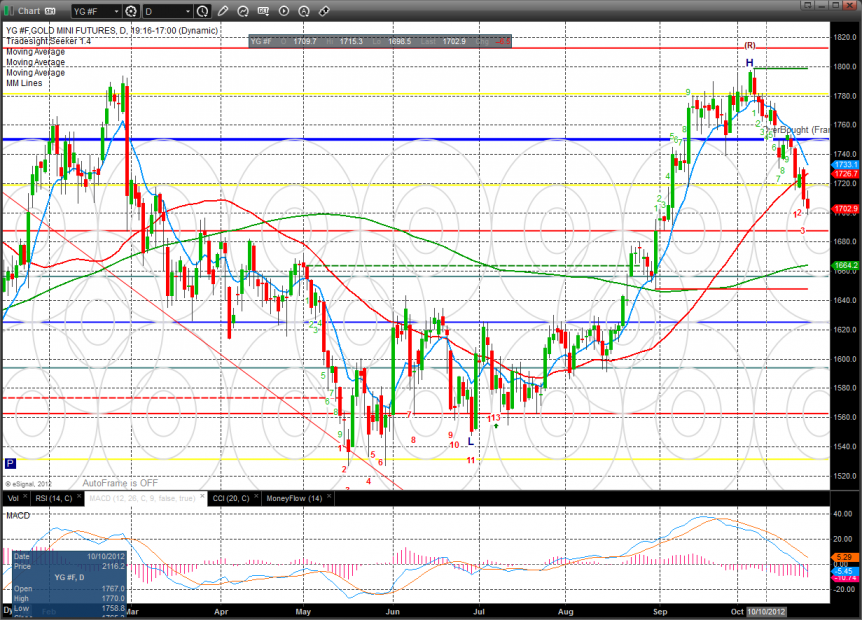
Gold:
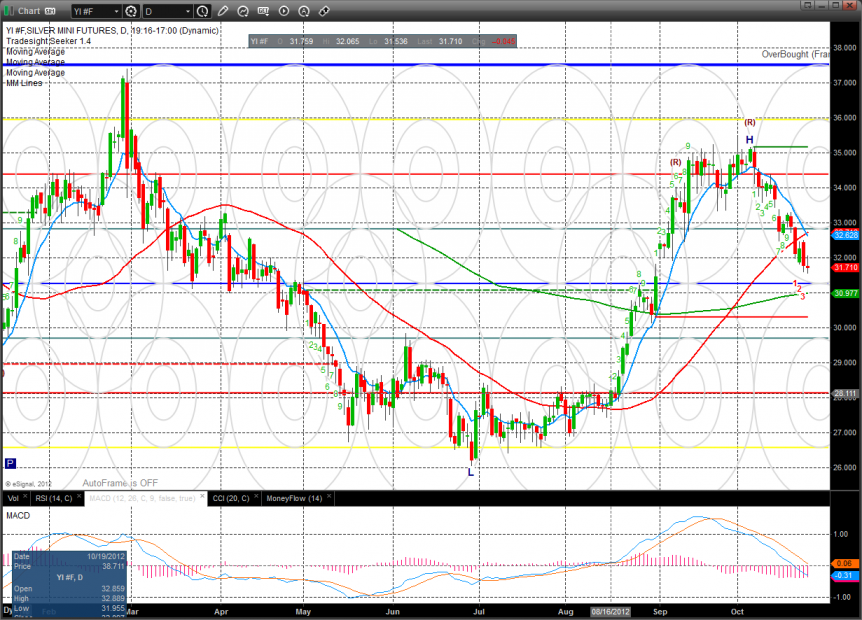
Silver:
Tradesight Market Preview for 10/25/12
October 24, 2012
|In Tradesight
Tradesight Market Preview for 10/25/12
October 24, 2012
|In Tradesight
The ES logged a pretty flat day but expanded the downside range and made a second close below the static trend line which will now break it. Key support remains at 1406.
The NQ futures were lower by 10 on the day settling right at the key 200dma. Keep in mind that the 200dma tends to get gamed when first tested so be prepared.
The 10-day Trin is still carrying oversold energy.
Multi sector daily chart:
The NDX vs. SPX shows the troublesome relative weakness in the NDX. There is some separation in the chart and traders should be prepared for a window where the SPX has some relative weakness while the Naz side uses the 200dma for support. This won’t change anything but after this window closes then the relative behavior again becomes front and center.
Copper, affectionately known as the PhD of commodities, has broken decisively below all major moving averages. In the chart of the copper tracking JJC etf, there is now no noticeable support until the Seeker static trend line at 43.75. Careful examination of the chart patter will show a multi month island in place.
The HGX housing index was the top gun on the day. The pattern has had a very nice run and is only one strong day away from a Seeker 13 exhaustion signal.
The BKX was lower on the day but outperformed the NDX. Price has yet to violate the Sep low and the 50dma—this is the key area.
The BTK is breaking with the 200dma in sight. Note that the MACD is in a very bearish position with downside momentum gathering.
The SOX index has bearishly made a new low on the move asd is now to the last real area of support before the prior lows.
The OSX was weaker than the broad market and is back down to key support.
The XAU was the last laggard and has settled below the low of the recent trading range. Keep a close eye on the key 175, 4/8 level for the next area of support.
Oil:
Gold:
Silver: