Friday, the SP futures were higher by 8 handles, closing at the high of day and the high of the move. Price settled just below the Seeker exhaustion signal disqualifier. Since there is no stronger signal than a failed one, a break above the Seeker risk level will be strong confirmation of continued upward momentum.

Below is a look at the weekly SP. Price is well above the 62% fib, which is often where a trend will terminate. Since price has held above the 62% fib, target 1370 for the next area of Fibonacci resistance.

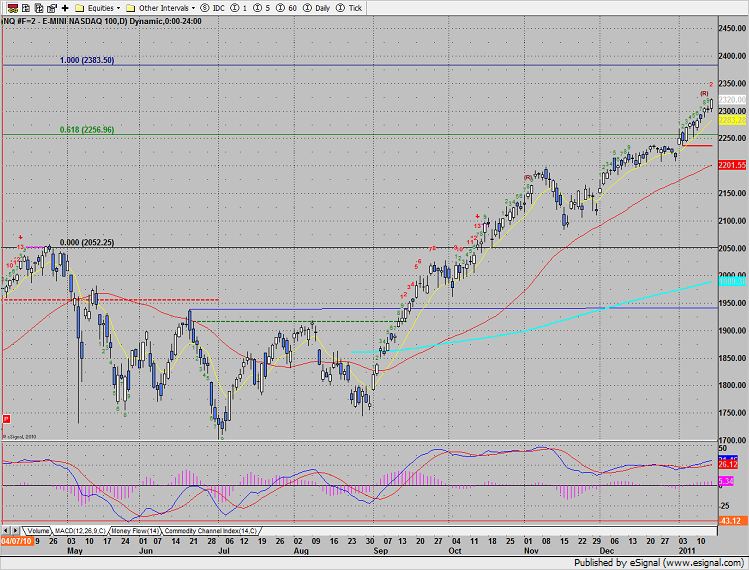
Naz closed at the high of the week and the high of the move, adding 17 on the day. The next meaningful target is the Fibonacci extension measured from the July low to April high–this projects price to approximately 2383.
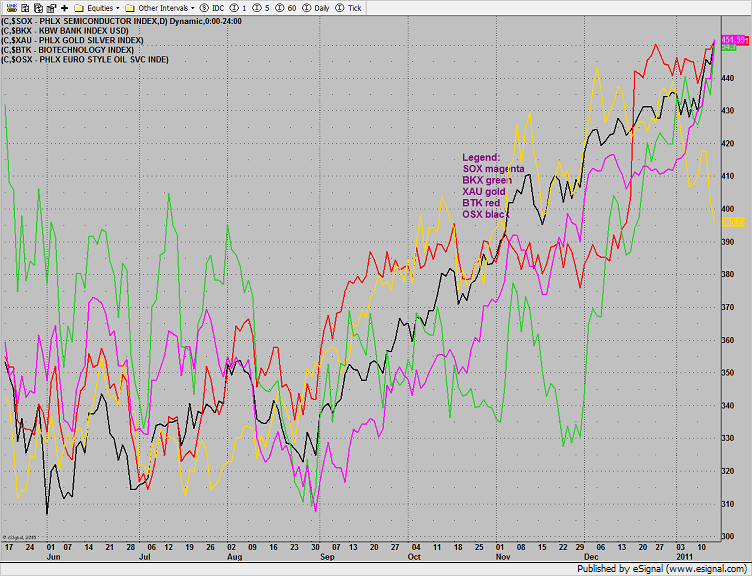
The multi sector daily charts shows how the gold stocks have become a source of funds where money is rotating into the higher beta growth sectors like semiconductors and middle cycle stocks like energy. This is a healthy development.
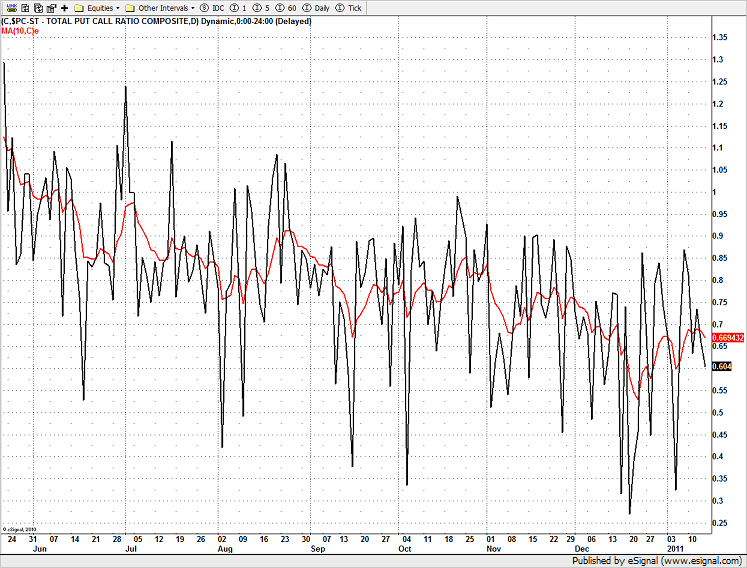
The Put/Call ratio continues to show complacency by the bulls. The broad market advance remains uncorrected since the 12/1/10 breakaway gap.
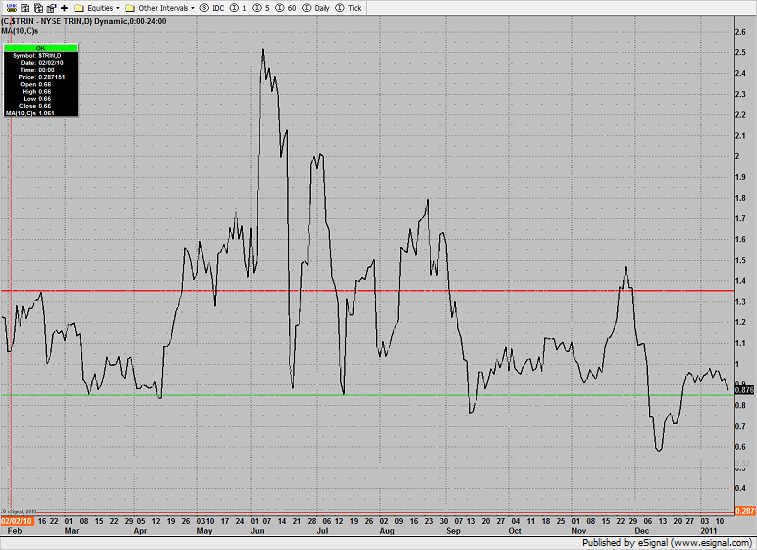
The 10-day NYSE Trin is getting near the overbought threshold at 0.85 and hasn’t had any relief since Thanksgiving.
The SOX was the top performing sector Friday. Fibonacci extensions have been added to the chart for the next trade-to-target. Keep in mind that some form of corrective activity may be needed before hitting 62% fib.

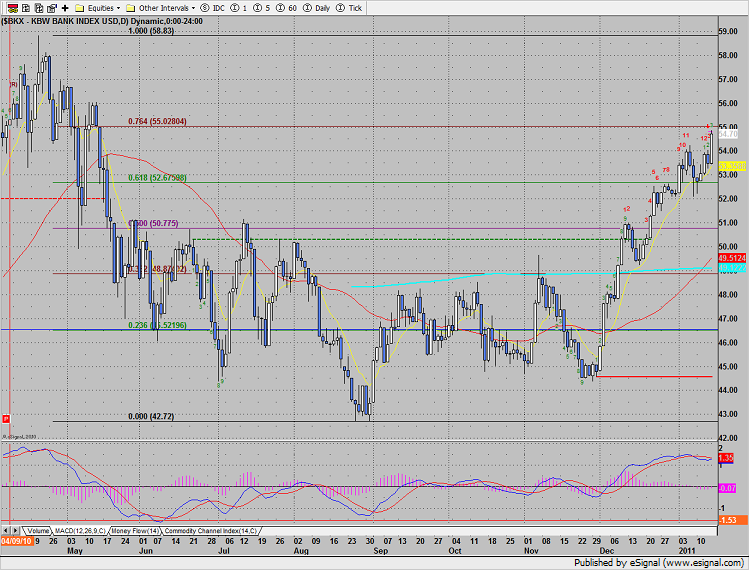
The BKX hit the next relative fib and now has an active Seeker exhaustion signal in place.
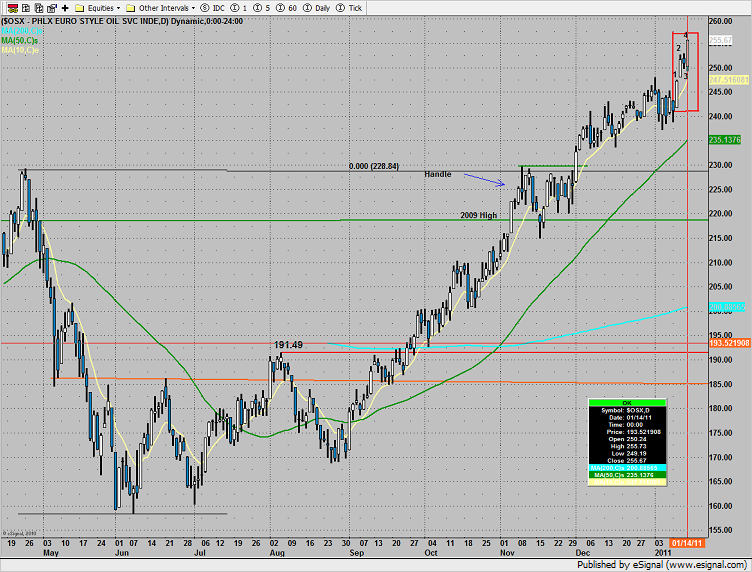
The oil services index closed at a new high on the move, but the news isn’t all good. The OSX has traced out a very powerful 4 bar reversal pattern. This pattern is known in Tradesight vernacular as the “trend termination” pattern. This four bar pattern, highlighted in the red box on the chart, must have two consecutive up days (candles 1 & 2) followed by a negative close that produces a new high intraday (dark body candle 3) then an up candle (4) that completes the pattern. There can be no deviation form the requirements and all of the 4 candles must form one after another without pause. The trend termination pattern is 70% successful in changing the trend when formed at range high.
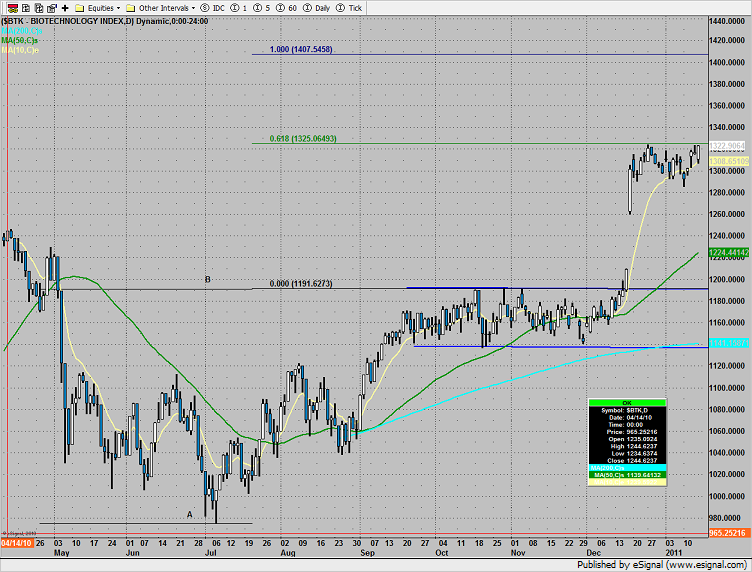
The BTK is currently consolidating the recent burst under the first measured move target. The chart has the 4 bar trend termination formation but calling Fridays close “at range high” would be dubious.
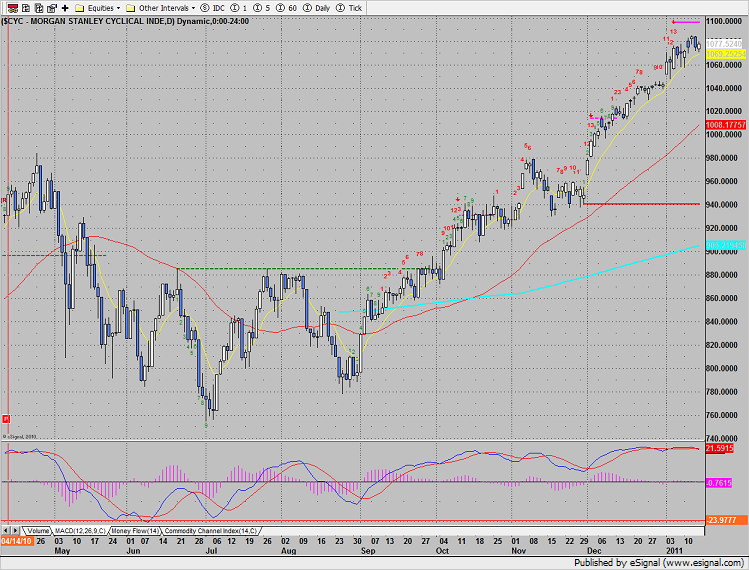
The CYC index failed to produce a new high and still has a Seeker exhaustion signal in place. This is a cause for concern for the broad market bulls.
The XAU is making good on the Seeker exhaustion signal (red arrow, candle 13) and continues to be a source of funds. Since the decline is technically only 2 bars down, the static trend line (yellow arrow) should be the working trade-to-target.

Oil settled below the 2010 high:

Gold continues to be repelled by the triple top, a break under 1350 (lower red line) could kickoff a full blown selling episode and put the 200dma in play.

Silver, represented by the SLV etf below, is tracing out a head and shoulders pattern. Price projects down to 24.27 if the neckline is broken.

Tradesight Market Preview for 1/18/11
January 15, 2011
|In Tradesight