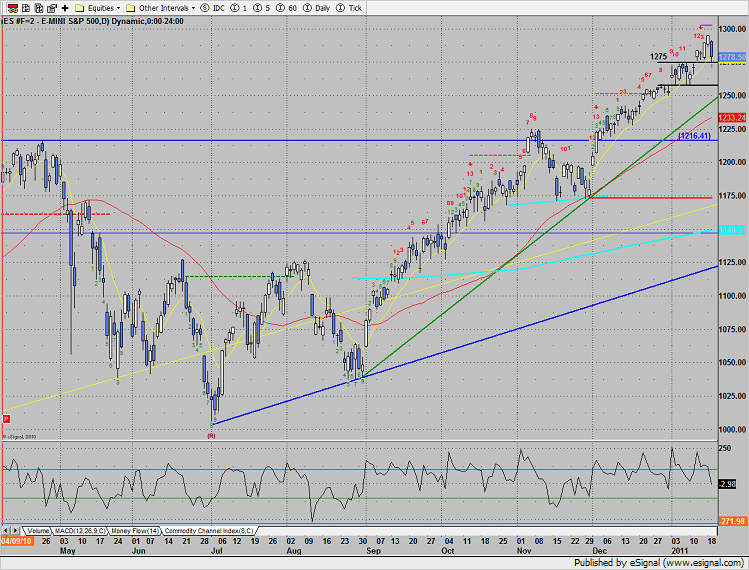
The SP gapped lower and recorded most negative candle since the December 1 breakaway gap. This could be the beginning of a correction. Wednesday the Trin closed at 2.31 which is bearish but not an extreme reading that needs relief. Since the Trin didn’t close above 3.0 more downside could be seen immediately tomorrow. The important near term levels to watch are the 1275 breakout level and the 10ema. If negative price action begins to develop a close below the DTL (green) would be very negative and open the door to a full correction down to 200dma. Savvy SP traders know that the SP futures like to move in increments of 5.556%….connect the dots. More on this if it develops.
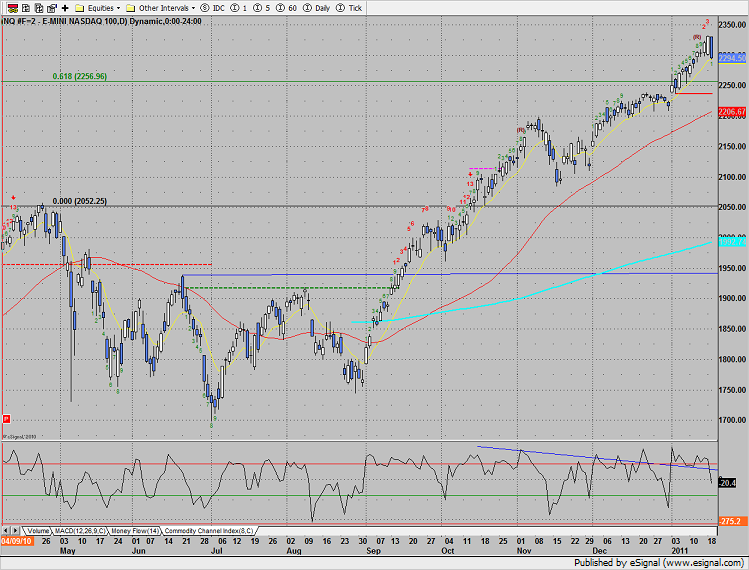
Naz lost 36 on the day, barely settling above the 10ema. Note that this is a 4 day low and started a Seeker setup count (green 1 under Wednesday’s candle). The earnings from AAPL were sold and the implication of AAPLs overweighting in the NDX could really get the index and underlying futures moving. The price action in the next few days is very key.
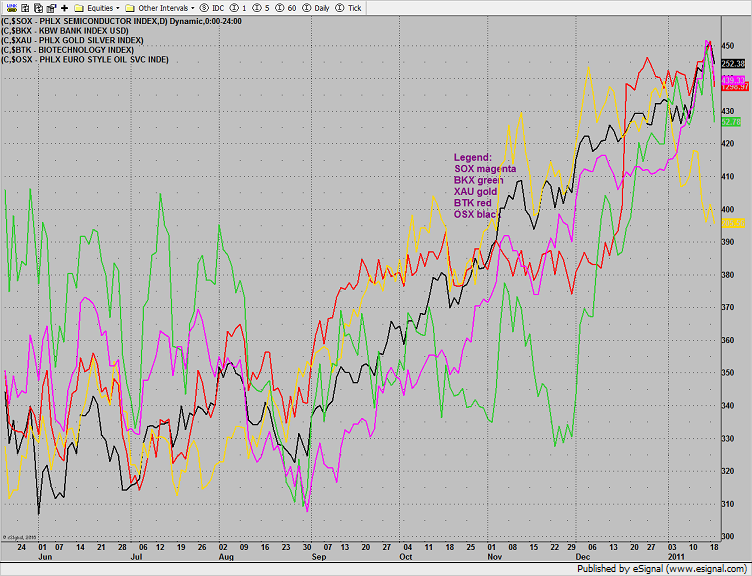
Multi sector daily chart;
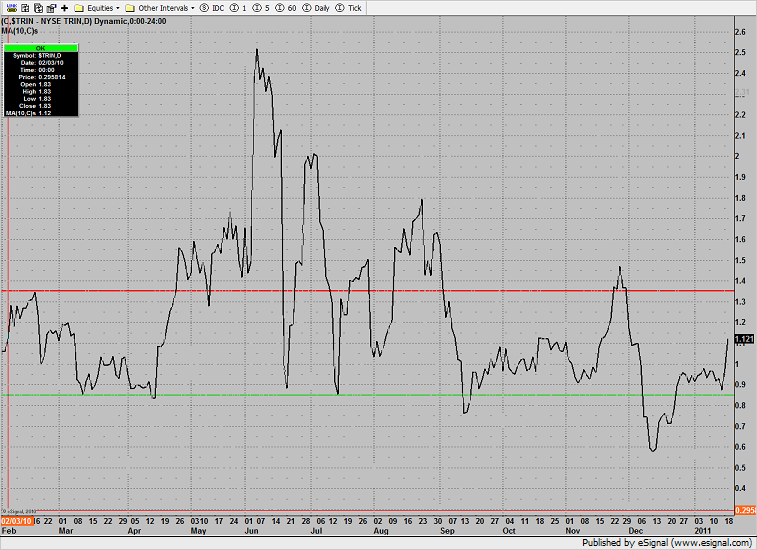
The 10-day Trin is moving higher but well below the 1.35 threshold that would signal an oversold condition in the market. There is plenty of gas in the tank for much lower prices.
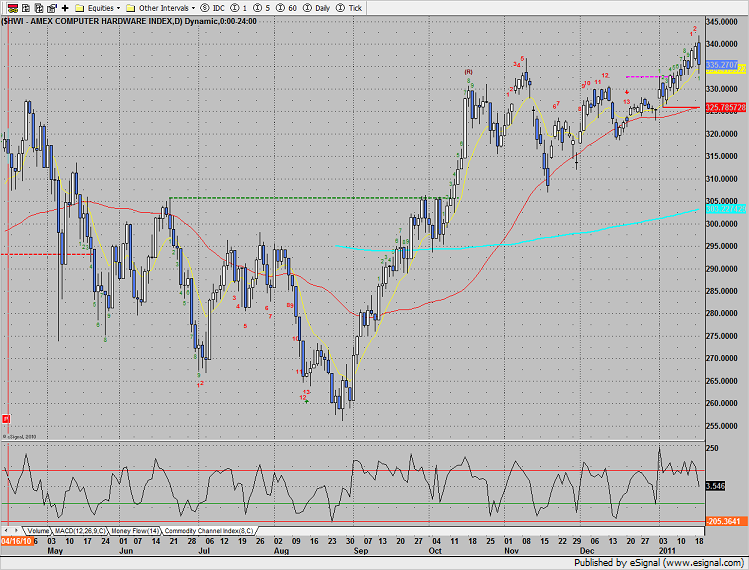
The AMEX computer hardware index, HWI, registered a bearish outside day down at range high.
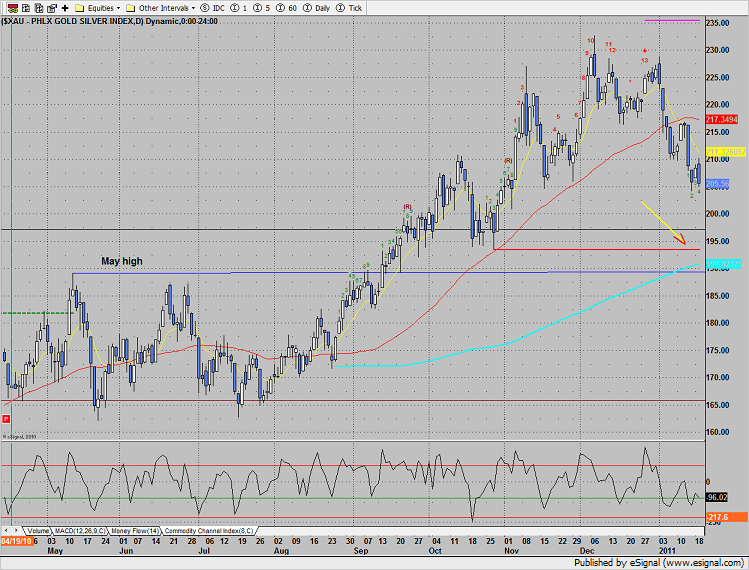
The XAU settled at a new low on the move. A break under Friday’s low puts the static trend line in play.
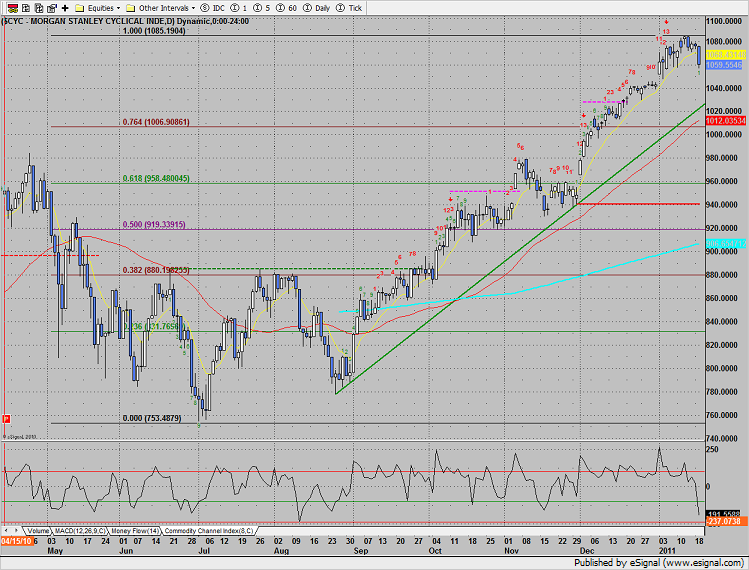
The CYC cyclical index had validated the Seeker sell signal by settling below the 10eam. Fibs and an intermediate DTL have been added to the chart.
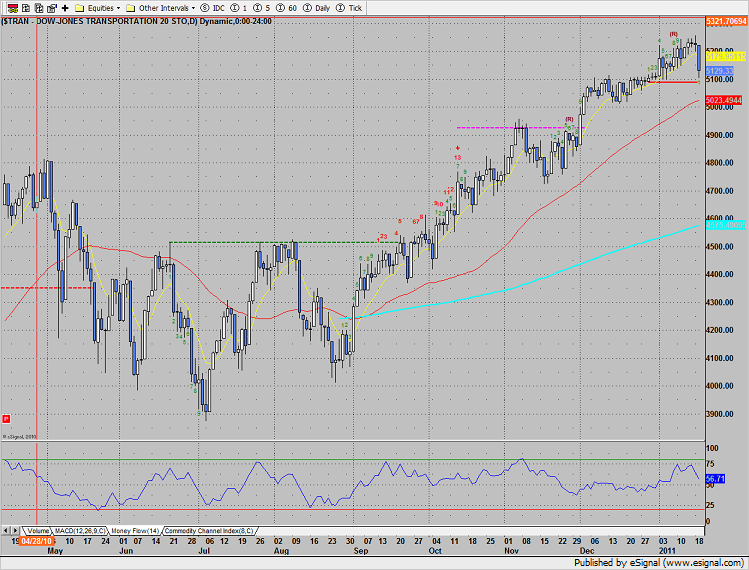
The Dow transports broke hard. Note the lower high in the money flow reading at the last top.
The OSX registered a range high outside day down. A close under the 10ema will likely start a short term down trend.
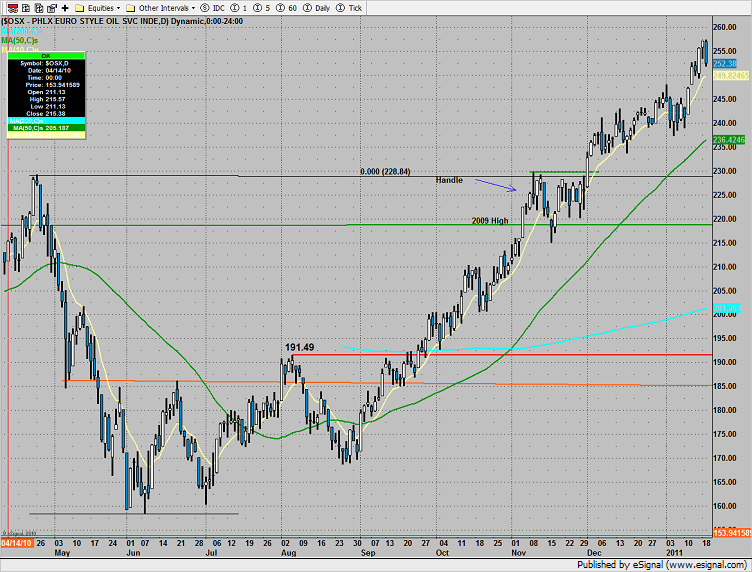
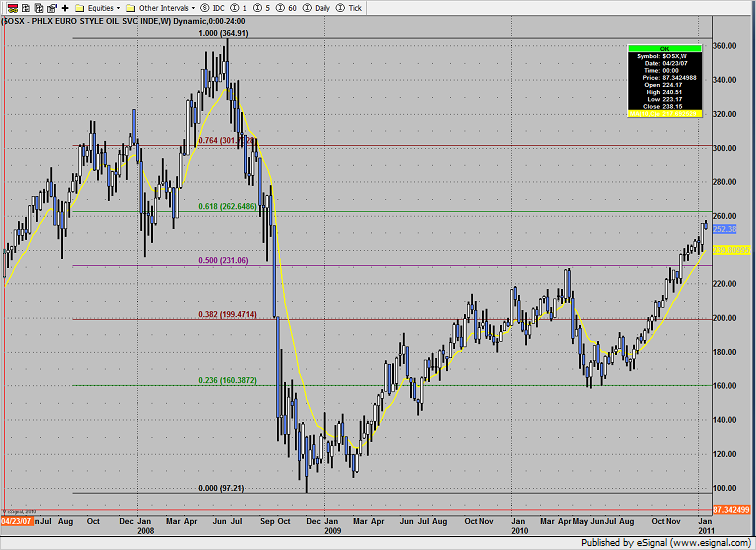
Below is the weekly OSX chart with fibs. The 62% fib is often key resistance.
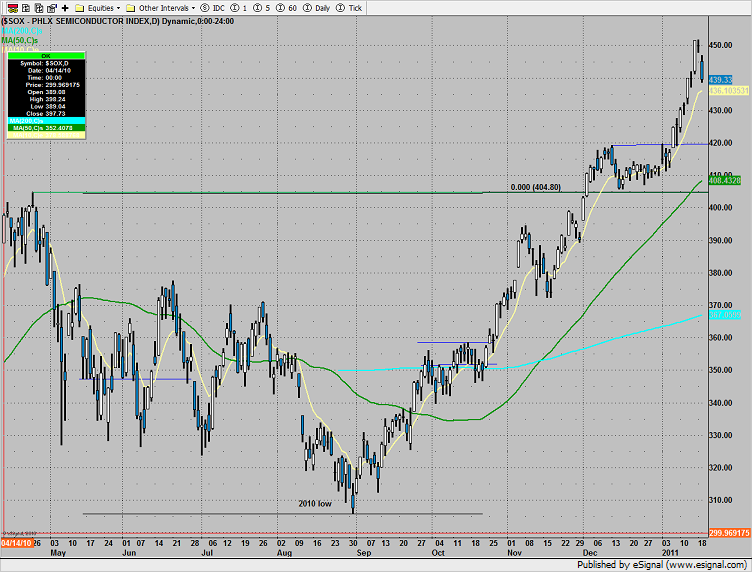
The SOX was lower by 2.3% underperforming the SP and Naz:
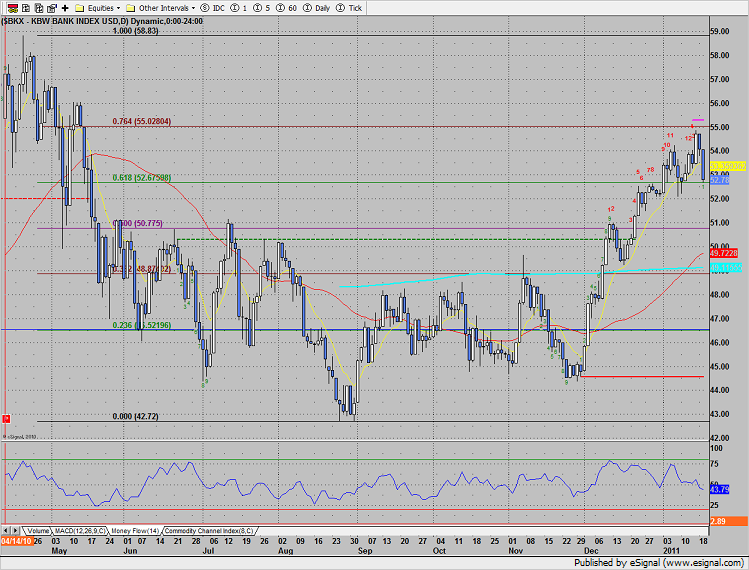
The BKX got hit very hard. The Seeker exhaustion signal is playing out nicely. Price settled below the 10ema and has put the 50% fib in play.
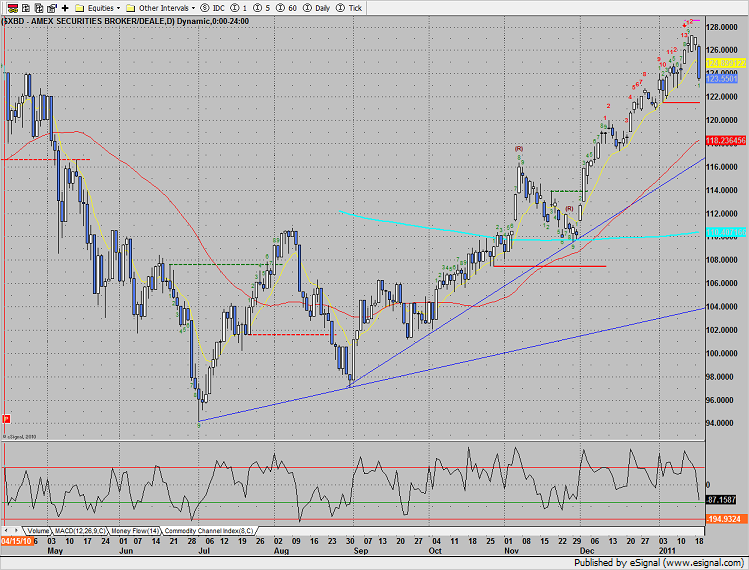
The broker-dealer, XBD index has made a turn and is making good on the Seeker exhaustion signal. Trend lines have been added to the chart.
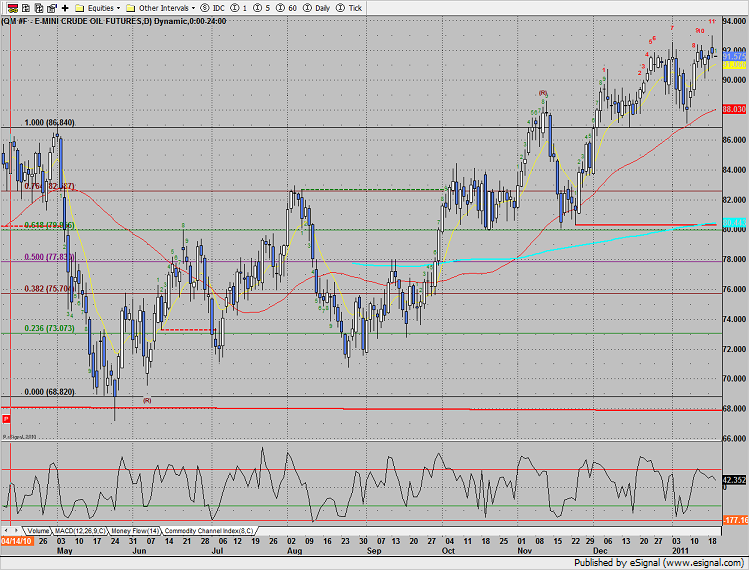
Oil is now 11 days up in the Seeker exhaustion countdown;
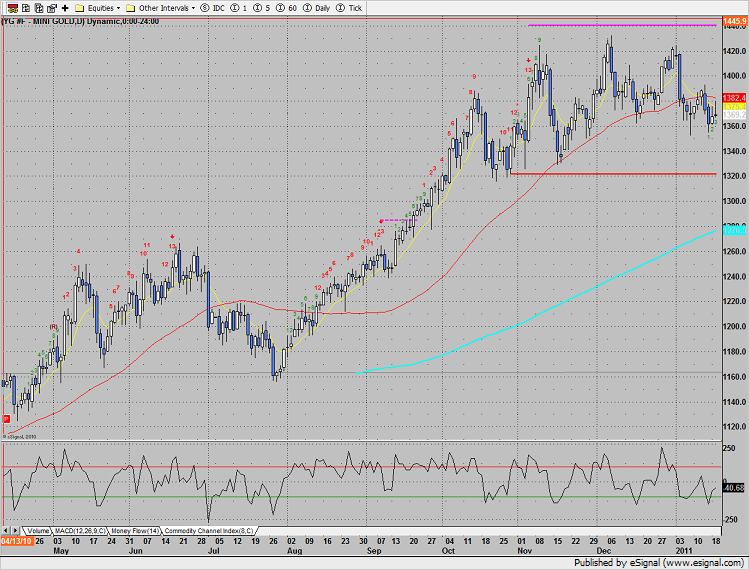
Gold was modestly higher on the day which is important. Gold was not used as source of funds which is a very small positive since not all asset classes were liquidated during the session.
Tradesight Market Preview for 1/20/11
January 19, 2011
|In Tradesight