2011 was an interesting year for Forex trading. The earthquake in Japan put a damper on trading of the JPY, and the situation in Europe kept the rest of the world watching to see what would happen, although in the end, not much did. We will start by reviewing the current state of the US Dollar from different timeframes, then discuss what this meant for trading month by month in the year, then look at the various pairs and how they moved, and finally wrap it up with our trading results for the year. I’ll give you a quick preview. Our trade calls for the year using our strategy of entry, stop, first target, and stop adjustment for final exit resulted in 3096 pips in net gains.
Before we get started, I just want to point out that you can review every trade call that we made during the year by clicking here and scrolling down as far as you want. You can also view our month by month net results by clicking here and doing the same.
Let’s start by looking at the US Dollar Index in 2011, which formed a giant cup formation, which is extremely bullish. The construction is outstanding and bodes well for a breakout if it happens. That move should lead to something nice for the bulls. Here’s the chart, and you can see that we ended the year about where we started:
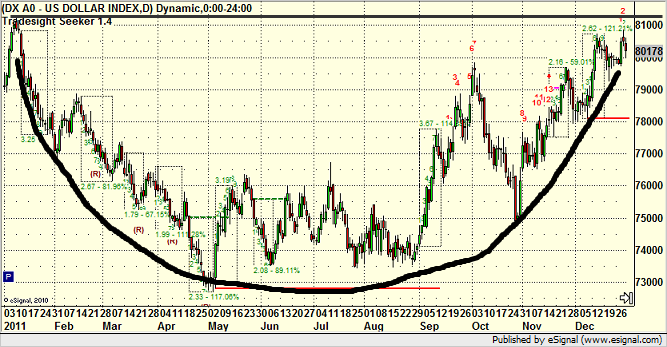
Let’s also note how some of the months fared in terms of range of movement during the month. You can line this up later with our month-by-month trading results. The best ranges were April, May, June, July, October, September, January, February, November, March, December, and August, in that order. Most years, we see that August is a slow month as much of the big players are on summer vacation, and 2011 was no exception as you can see. December was also slow, as often happens.
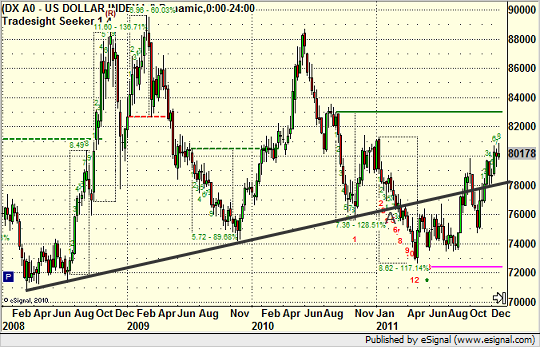
If we back out the chart and look at the last 3 years on the US Dollar Index, we get a different view. Early in 2011, we actually broke the two-year uptrend line that had been in place, which looked dangerous at the time, but the years “cup” construction got us back above that line by the end. From this perspective, the low on the US Dollar Index occurred in the middle of 2008 (this is a weekly chart):
Now let’s back the chart out even further and look at the monthly chart going back over a decade. Several things are important here. First, the US Dollar collapsed sharply during the decade, especially from 2001 to 2008. The bottom so far is clearly in 2008. In addition, the primary downtrend line (A) broke in October 2008 (point B on the chart). With the low in place and the construction of the “Cup of 2011” as I refer to it, we have two keys to watch in 2012. First, will the US Dollar break out of that 2011 cup, and second, the next major resistance is the line that begins in 2006 but connects through C and D on this chart:
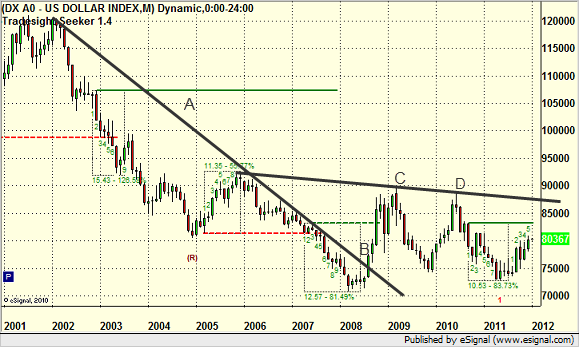
Forget for a moment that this is the US Dollar that we are charting. Any chart that has a breakdown as sharp as that one did over the better part of a decade will take a lot of work to get it turning back up. Whether 2012 is the year that the Index can turn up and breakout after the decent construction of the last few years will have to be seen. If it does, expect better volatility than we have seen this last year, which will be even better for our trading. But again, it could take more work before the real breakout resumes.
Just remember that while further troubles out of Europe might be bad for the US economy in the short-run, they would be positive for the Dollar, and ultimately, that will be a plus for the US, which is no longer anything close to a manufacturing economy and thus doesn’t benefit much from a weak Dollar.
I have taken the 2011 charts of each of the ten pairs that we provide Levels for each day. I drew a flat black line from the start of the year, straight across, so you can easily see if the pair was up or down for the year. Let’s go through them with some additional comments.
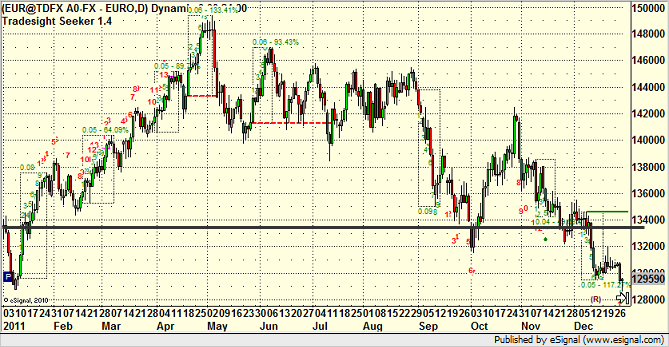
EURUSD, our most commonly traded pair this year, ended up almost exactly where it started, which is interesting considering all of the troubles in Europe all year long. It basically just looks like the inverse of the US Dollar Index:
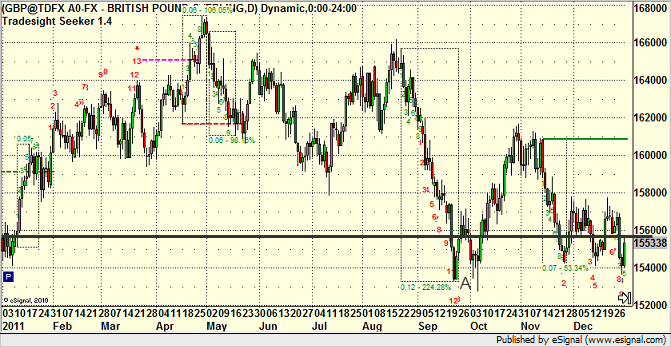
GBPUSD, our second favorite trading pair, was a little wilder but still ended up close to where it started. Note the Seeker 13 bar buy signal on the weekly chart right at the low of the year, which is amazing:
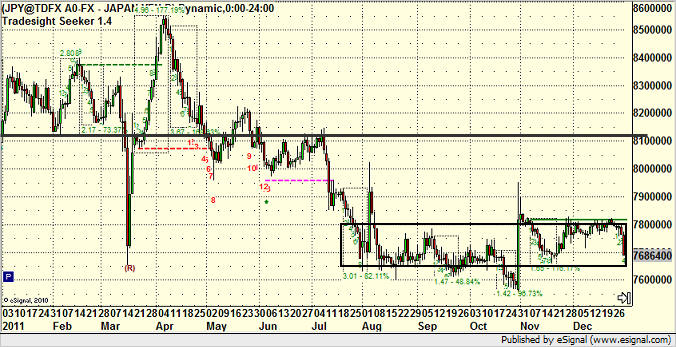
The USDJPY had some volatility early, but look how flat it became after the earthquake hit the island nation mid-year. It was untradeable after that, with many days of only 20-30 pips of range:
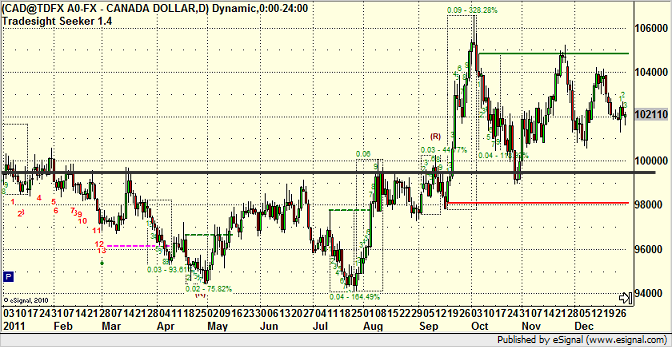
USDCAD:
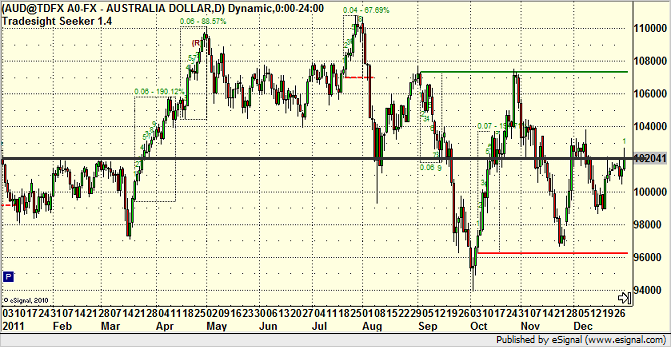
AUDUSD became a better trading pair this year as the daily range improved sharply, but you wouldn’t know it from this daily chart which was pretty flat overall and ended up where it started:
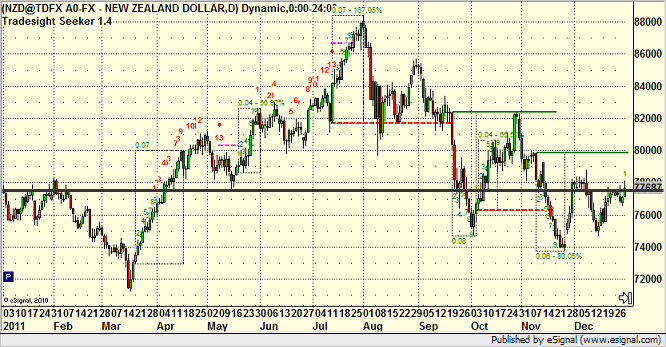
About the same for the NZDUSD:
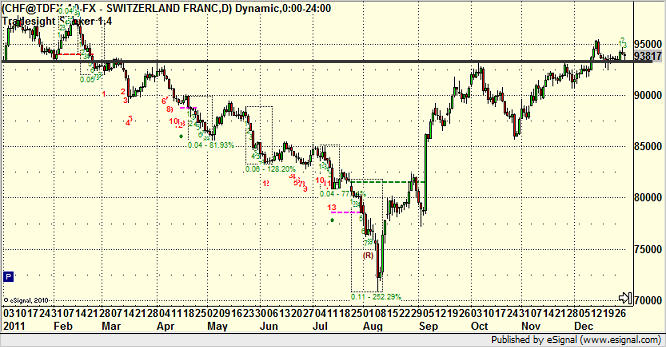
USDCHF:
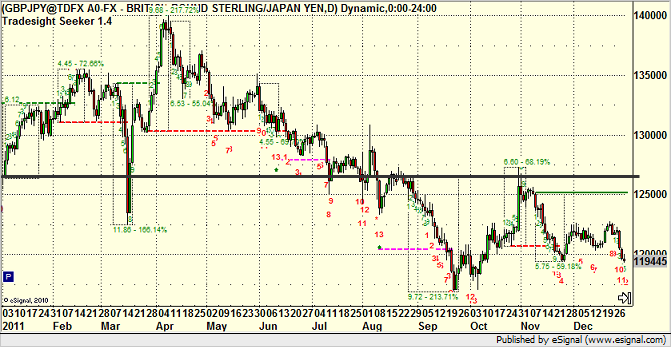
GBPJPY:
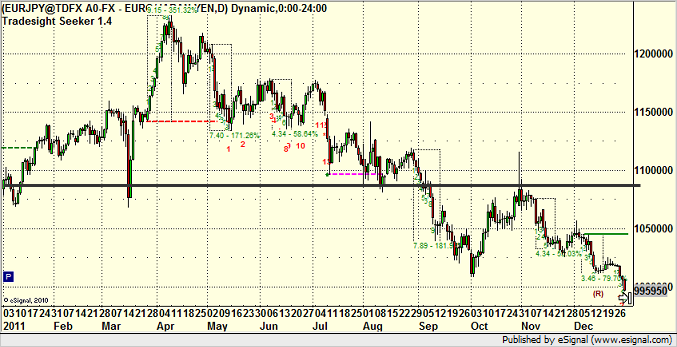
EURJPY:
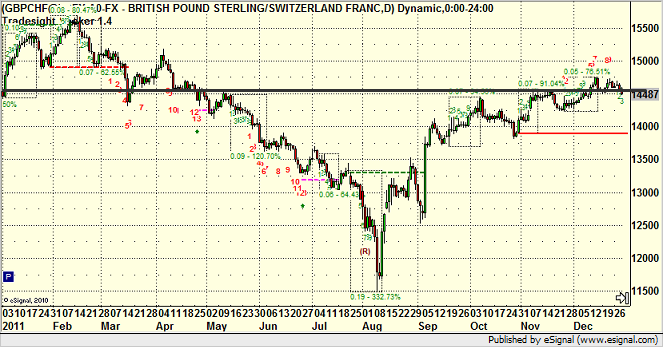
GBPCHF:
Finally, let’s get to some trading results.
From January 1, 2011, through December 31, 2011, we had 432 trade calls trigger. 219 of those led to winners, which is a 50.7% win ratio. Some months were better than others, obviously, but our system targets a win ratio in the 50-60 percent range, so we hit that number (just barely). The losing trades are always kept to around 25 pips.
So we average about 36 trades that trigger per month. Out of the twelve months, only January resulted in a loss. The other 11 months were all positive, although months like December, where the market was slow, were barely positive. The best month of the year was June with 645 pips of net gains, but October also had 600 pips. Working our way down from there, other good months were August, June, April, and February. The slowest months for results were January (negative), November, and December. It’s interesting that we managed to have a decent month of August despite the typically horrible ranges in that month.
Our total net gains including stop outs (losers) selling half at first targets, and managing the trade calls as we did in the Messenger to final exits when they worked was 3096 pips. Not a bad piece of work.
I still feel like we can do better in a year that isn’t so net flat, but we have seen worse years when the ranges dip for several months in a row instead of just August and December, so I have no complaints about how this year played out.
According to the Mayan calendar, the world comes to some sort of end in 2012, so I would expect that would cause some volatility. We shall see, but I’m looking forward to 2012 and trying to improve on this years results from the Tradesight Forex service, which is now entering it’s seventh year.
Tradesight Forex End of 2011 Summary and Results
January 2, 2012
|In Tradesight