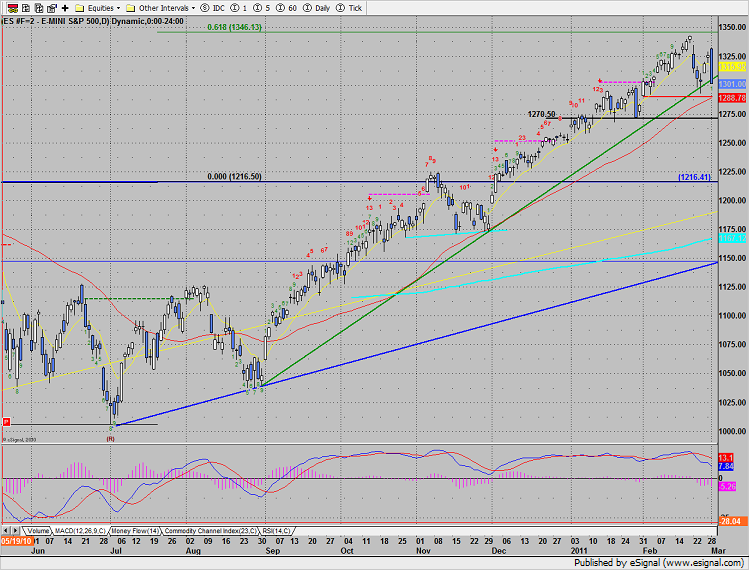
The SP gapped higher, testing the gap window form last week and was sold, sold, sold. At the close, price was at the low of the day actually closing the gap up from Friday. After all was said and done, price shed 25 handles and made the low close of the move off the swing high. The Static trend line form the 2/1/11 gap is the key level. The Seeker has just recorded a price flip and also settled below the near term DTL.
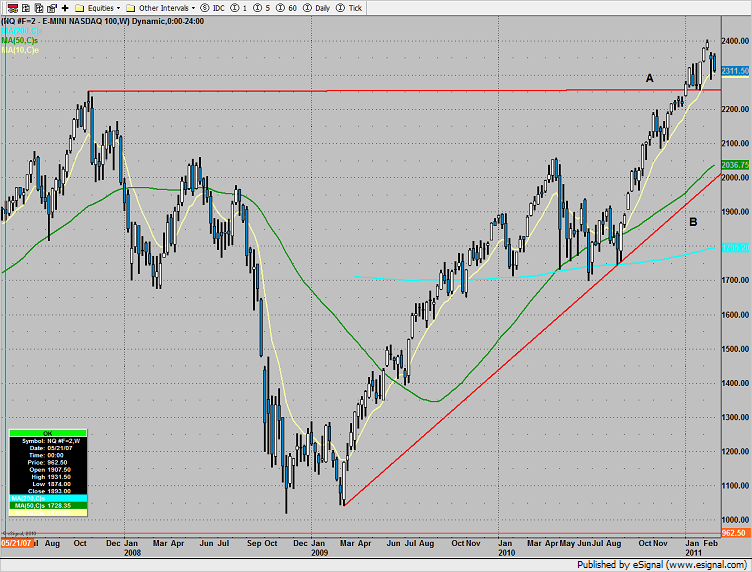
Naz lost 39 and closed the open gap from Friday. For this report the weekly chart of the NQ futures is presented to show the flash crash swing low and the 2007 high (point A). Approximately 2253 is a very critical area. This is the breakout above the 2007 high and recent critical support on pullbacks. If this area is violated the short term trend will be negative. If price continues lower, the next focal point will be the primary DTL (point B) which if violated will turn the chart intermediate negative.
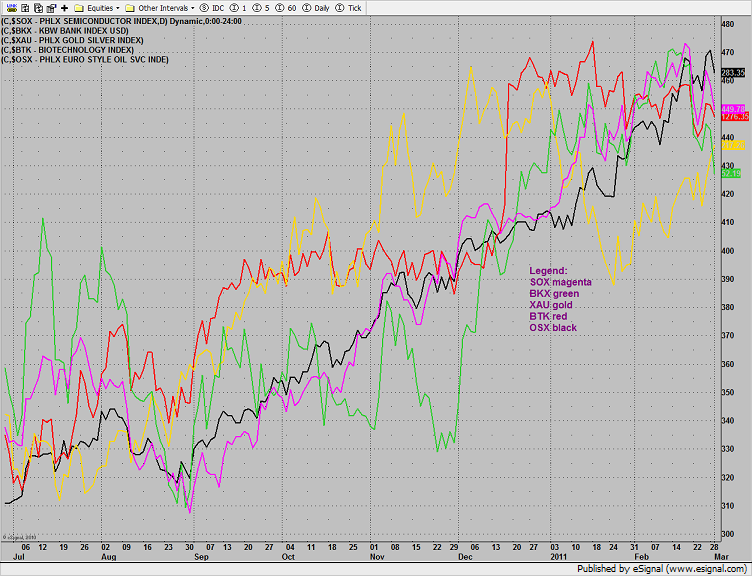
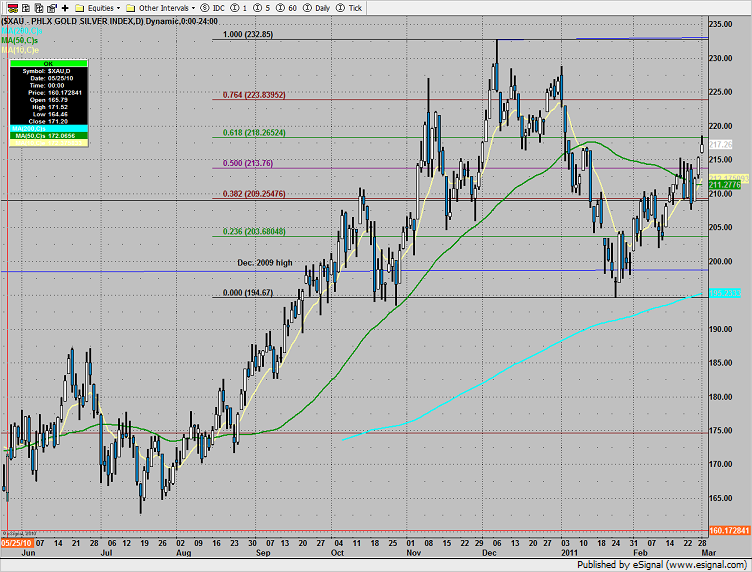
The multi sector daily chart shows the defensive rotation into the XAU.
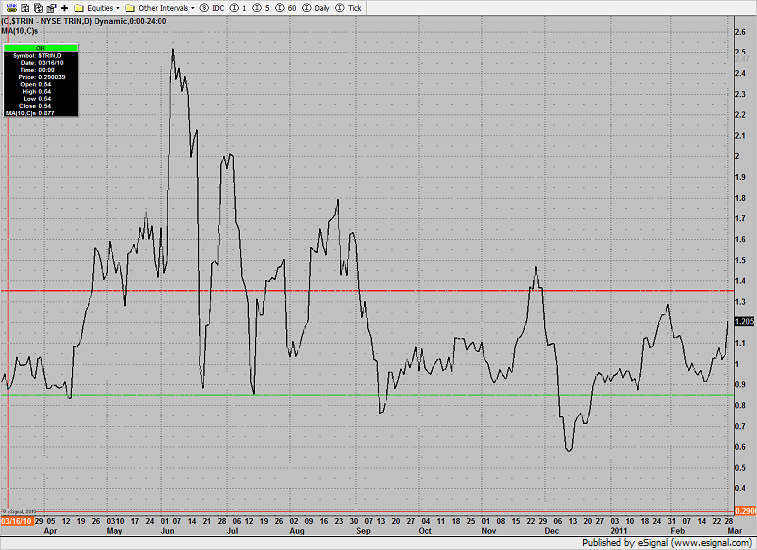
The 10-day Trin popped but is well short of the 1.35 oversold threshold.
The XAU made good on the 50% fib breakout and tagged the 62% fib. Price is now 3 days up which is often a pause.
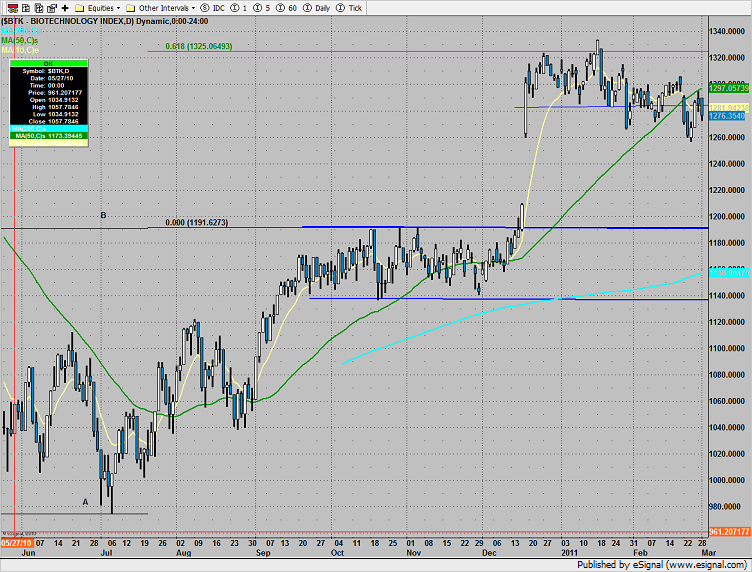
The BTK outperformed the market but remains boxed up:
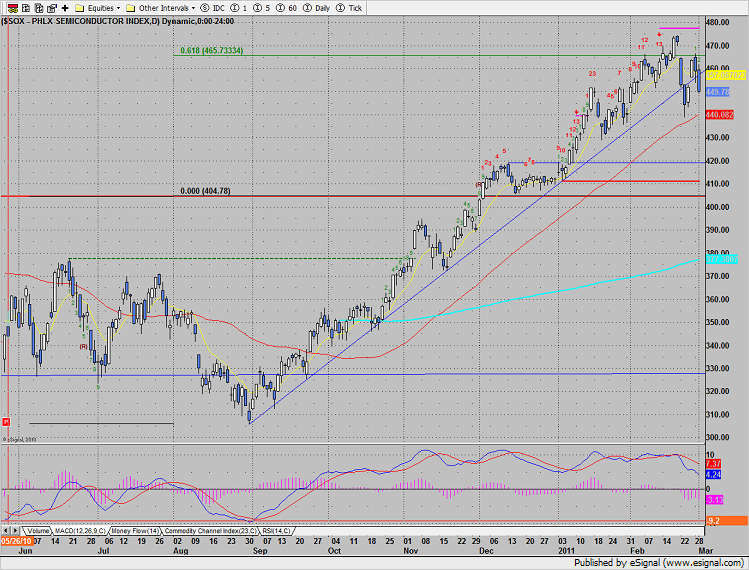
The SOX was lower by 2%, keep a close eye on the MACD zero line.
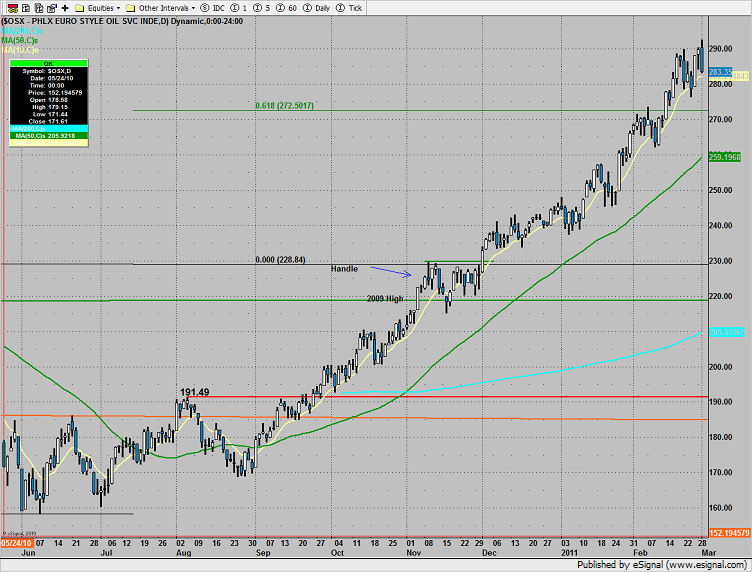
The OSX posted a range high outside day down. This is very often a lasting high water mark on charts.
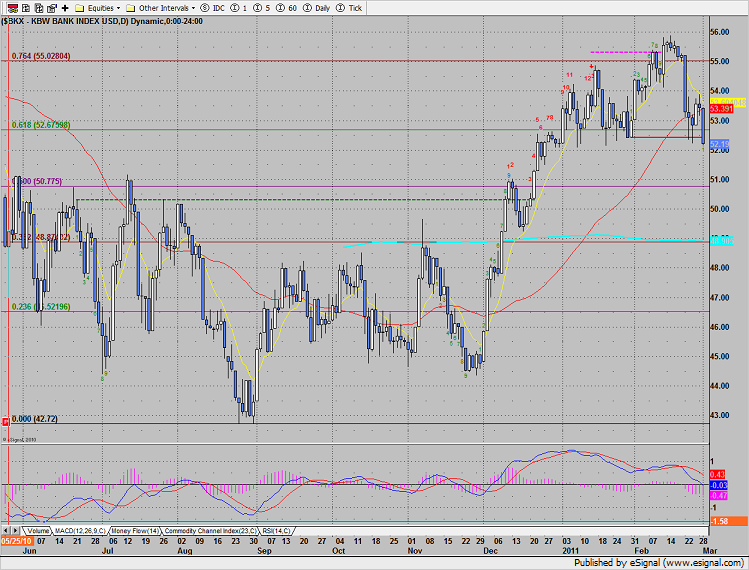
The BKX recorded the lowest close of the YEAR. The active static trend line has been violated and the current bar count is only one day down. Keep a close eye on the price action in AIG. The bias has been down and the US Treasury needs to sell billions of shares.
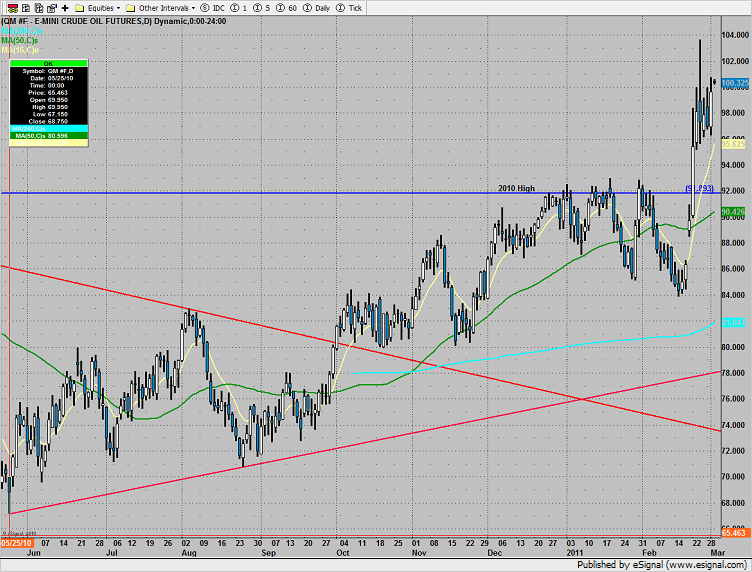
Oil recorded a new high close:
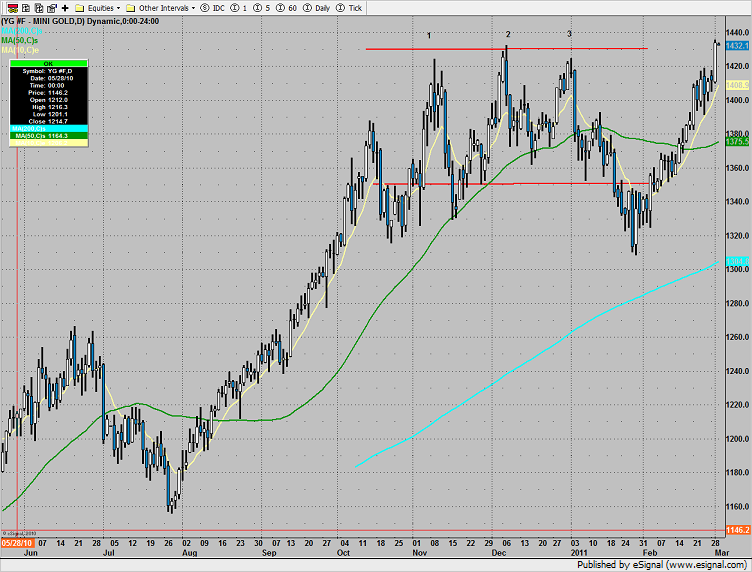
Gold broke out to a new high:
Tradesight Market Preview for 3/2/11
March 1, 2011
|In Tradesight