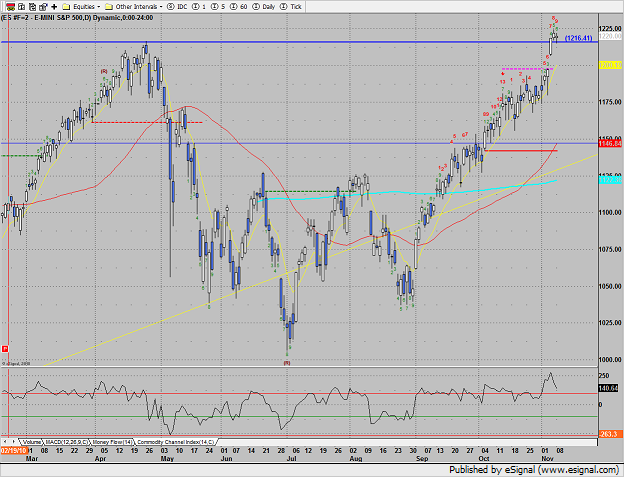
The ES continues to consolidate the recent breakout. 1216.50, which is the prior high from April has been tested and has so far held. Note that there is still a large gap just below on the chart.
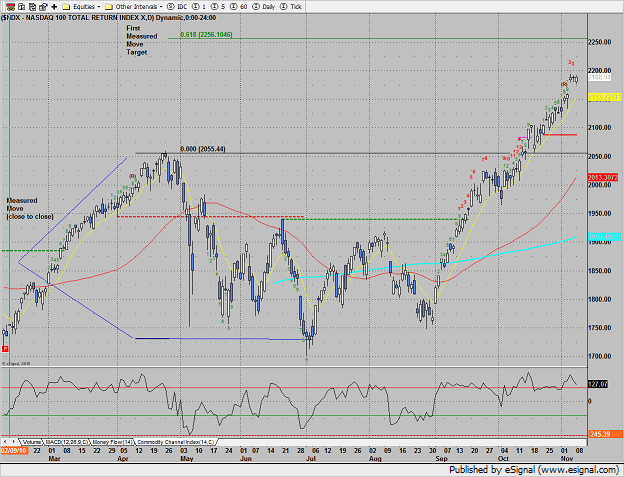
Naz was higher by 2 handles. A measured move target has been added to the chart. This is calculated by measuring the energy loaded in the chart on the most recent decline. This is from the April high to July low on a closing basis. Fibonacci extensions have been added to calculate the target.
Note how the XAU is getting extended in the multi sector daily chart:
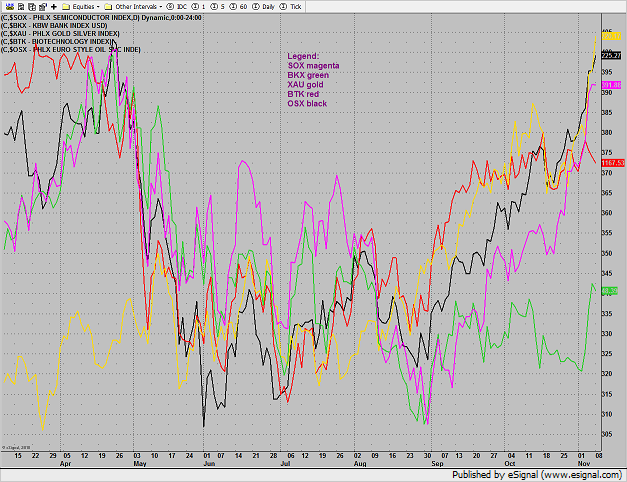
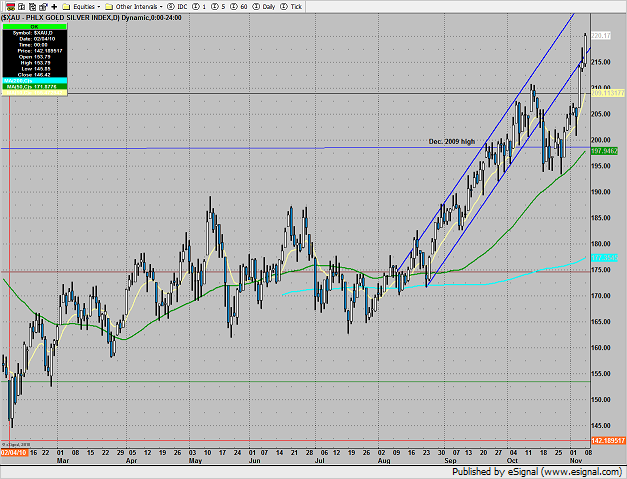
The XAU was top gun up 2.5% on the day. The pattern is extended and loaded with complacent bulls.
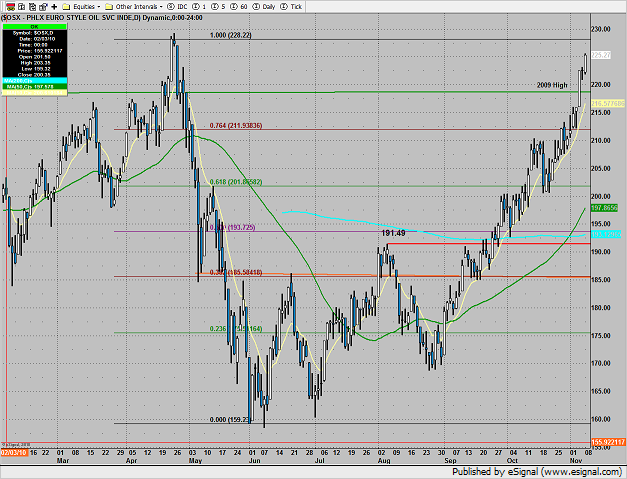
The OSX was very strong, outperforming the broad market even in the face of a stronger dollar. The April 2010 high is the next level to watch for.
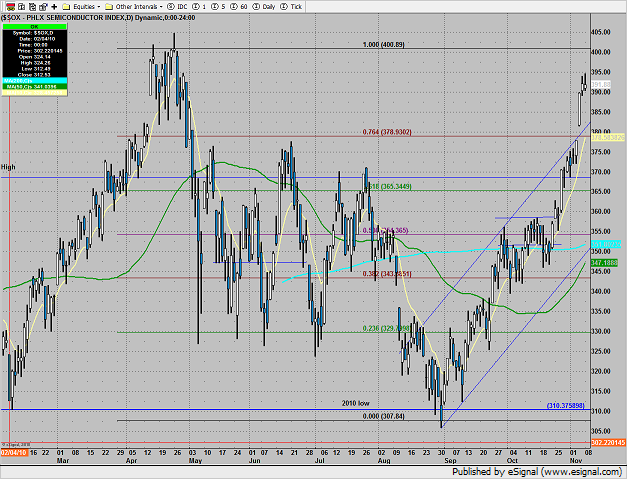
The SOX did very little almost posting an inside day. The topping tails from the last two sessions are a little concerning.
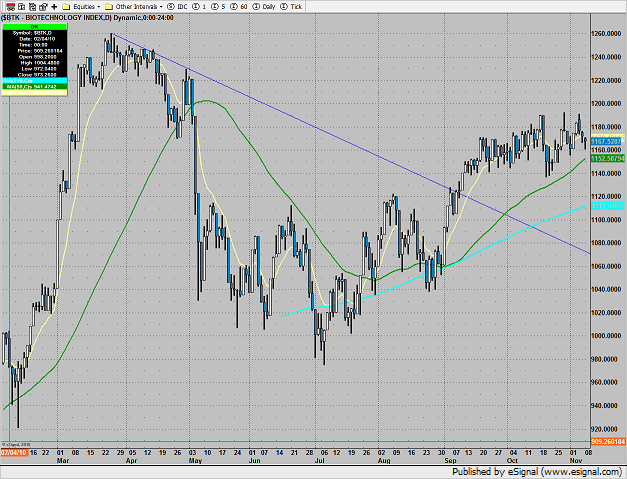
The BTK which has been consolidating sideways may soon get a lift from the up sloping 50dma.
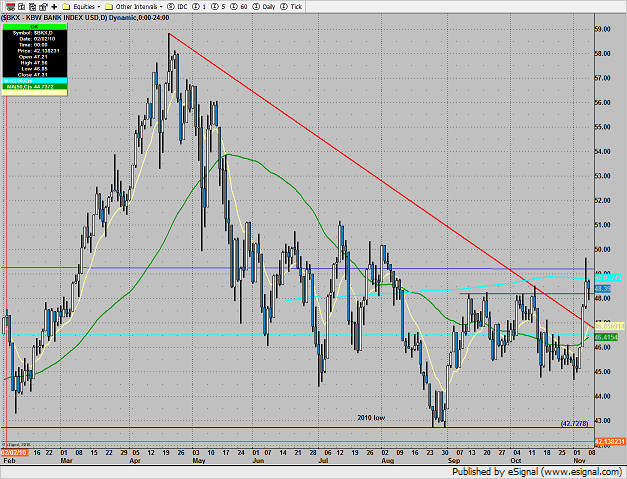
The BKX was likely the chief culprit for the decline in the broad market. The pattern has penetrated and taken out the DTL (red) but is finding resistance at the 200dma. Since today’s candle was an inside day a break above the 200dma 48.83 could trigger some nice follow through.
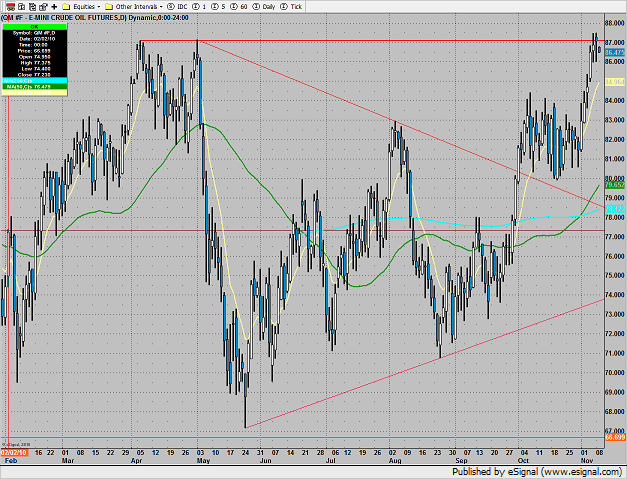
Oil is right at the 2010 highs:
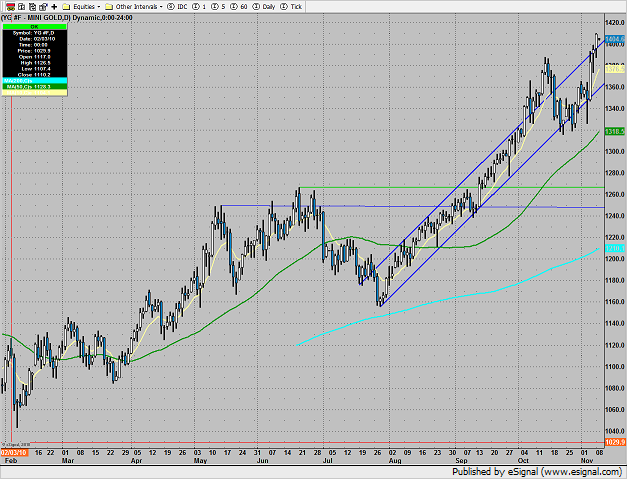
Gold continues to pound higher–new highs on the move were recorded.
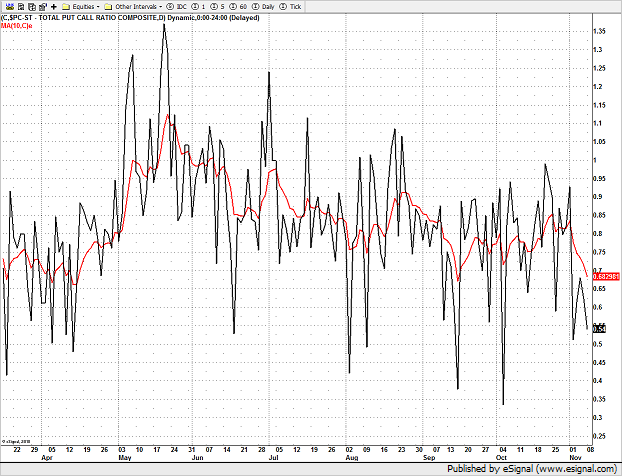
The Put/Call ratio is getting complacent but has yet to record a climatic reading.
Stock Market Index Preview for 11/09/10
November 8, 2010
|In Tradesight