We’ve had a lot of interest in our Seeker tool lately, so I wanted to take some time to walk through a 13-bar Signal on today’s GBPUSD 5-minute chart to show how the tool can be used.
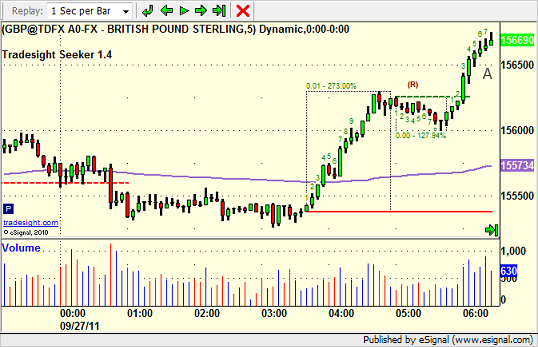
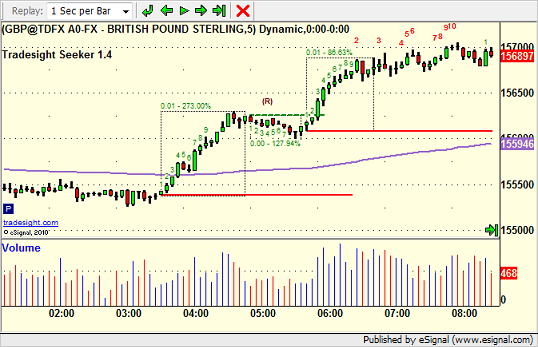
We’ll start with a look at the GBPUSD around 6:00 am PST / 9:00 am EST this morning (charts are PST). It is currently 7 bars into the SETUP phase of the Seeker tool, which are the green numbers. Once you get to 9 (see recent course for the count methodology); INSERT INTO `wp_posts` (`ID`, `post_author`, `post_date`, `post_date_gmt`, `post_content`, `post_title`, `post_category`, `post_excerpt`, `post_status`, `comment_status`, `ping_status`, `post_password`, `post_name`, `to_ping`, `pinged`, `post_modified`, `post_modified_gmt`, `post_content_filtered`, `post_parent`, `guid`, `menu_order`, `post_type`, `post_mime_type`, `comment_count`) VALUES the setup is complete and in place:
A few bars later, we get the 9, so the Setup is in force. The red count is the actual Seeker Countdown using a non-sequential 2-bar look back from close of the bar to low of the bar two bars back. Note that the red count begins as soon as the green 9 is complete:
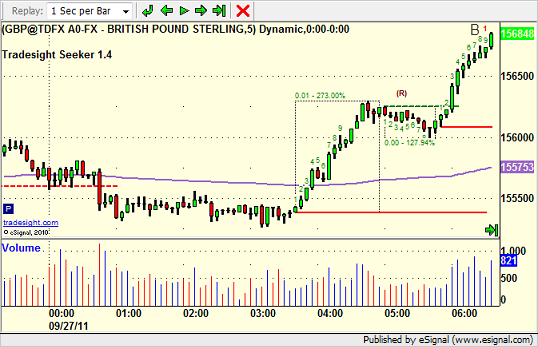
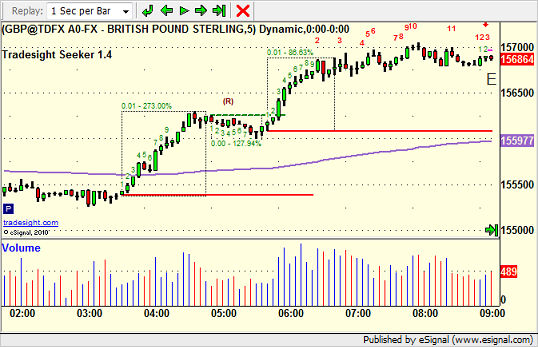
Also, understand that the 4-bar look back count that is used to generate the 9-bar green setup phase can actually continue beyond the 9th bar. Although you don’t need those additional bars (i.e. they are not labeled 10, 11, etc.) for the red Countdown to begin, our tool draws a box around the setup count once the 4-bar look back is broken. So in this case, the Setup count methodology continued for four bars after the 9, and then the box is drawn:
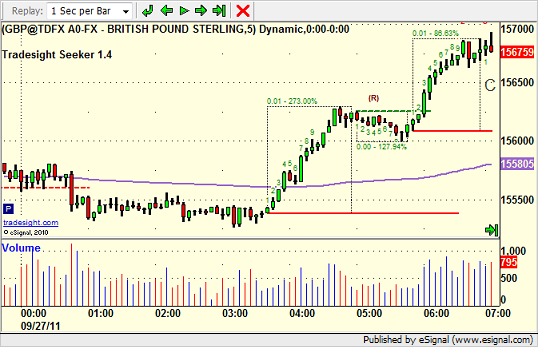
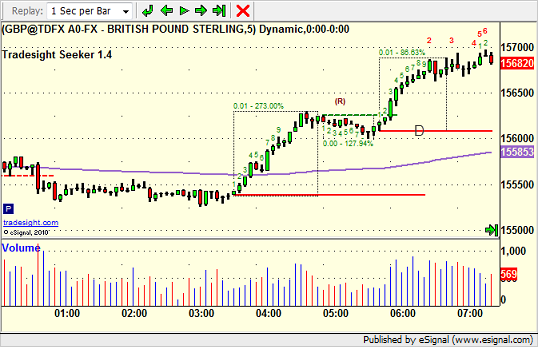
Moving forward, we now see the red count underway. Remember that this count does NOT need to consecutive. Also the red line D is the Static Trendline of the setup count, which is the low of the range of that count:
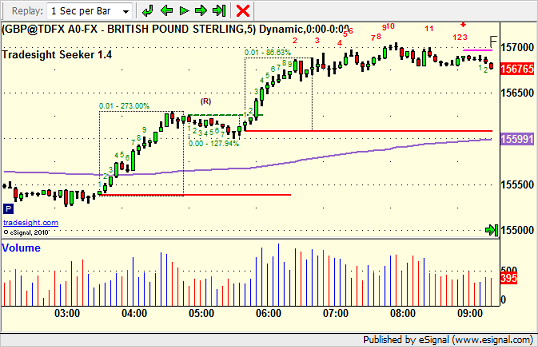
Seeker signals are a test of patience. This one proceeds fairly quickly but still takes over an hour to get to the 10th red count. 3 to go at this point:
Finally, we get our 13 signal, which is a sell signal by default. You’ll also see that the pink risk line begins to draw after that. Basically, the trade is to sell short at the 13 (or if you want to be conservative, sell when you break the low of a 5-minute bar after the 13) with a stop over the risk level:
The risk line is F, and the GBPUSD starts to roll without touching it:
Over the next 30 minutes, it works nicely as we shuffle into the end of day:
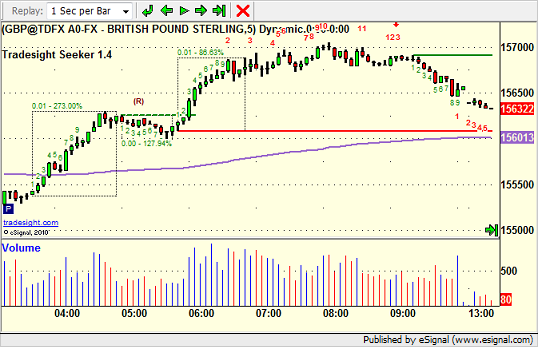
Ends up being about a 50 pip winner at that point. Hard to complain, and very easy to follow if you have time to watch. Note that this tool works on all asset classes and all timeframes equally.
Profitable GBPUSD Seeker Sell Signal
September 27, 2011
|In Tradesight