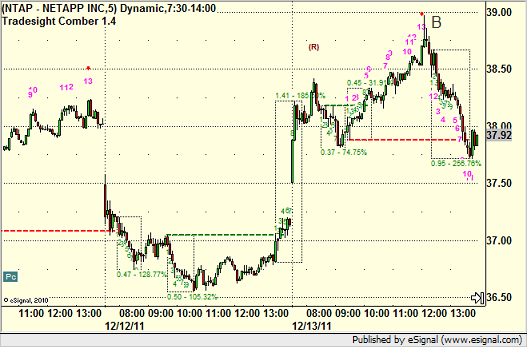
The other day, I posted an article (which you can read here) about the Comber wall of resistance over a couple of days on NTAP. There was actually another piece of the story that I’d like to point that makes the wall even stronger on the second signal.
Here is a look again at the Comber tool on NTAP, with the second signal in three days marked at B, as discussed in the prior article:
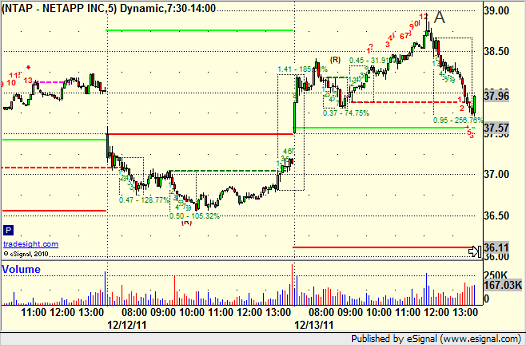
What I didn’t share in the first article is that our Seeker tool produced a 13 sell signal on the same bar, as seen on this chart at point A:
While the Seeker and Comber both share the same setup mechanism on their 1-9 green counts, and while the 1-13 countdown phases can have some similar characteristics, the fact that the Comber 1-13 count reaches back to the start of the setup phase while the Seeker does not means that they rarely give a signal at the same time. In this case, they both did, giving more power to the play and making it more likely to work, which it did that day.
Even more telling is to look at the chart two days later and see what that signal meant to the market:
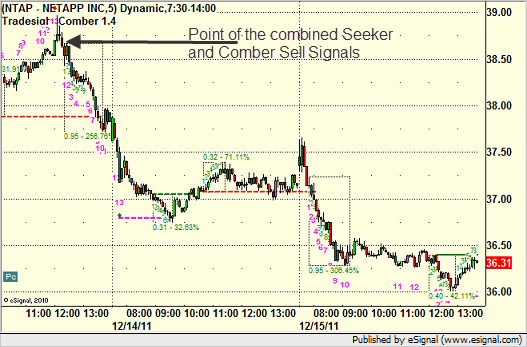
The power of the Seeker and Comber together at work.
NTAP Comber Wall Addendum, The Seeker Variable
December 15, 2011
|In Tradesight