Tradesight has been around for 10 years now. Amazing.
Before Tradesight was a website and subscription service, it was an email newsletter to my managed money clients as early at 1997. Each year since 1997, I write a summary report about the markets so we can all look back and remember what the year was like from a trading perspective. In prior years, I have made a single report covering the Forex, Futures, and Equity markets. This year, with much of our non-trade call stuff going into the Market Blog on the site and with a stronger split between Forex and Equity traders, I’ve broken the report up into two. This is the Equity/Futures review here.
Ten years ago, at the end of 2001, my end of year report stated that I felt that we were in for a Lost Decade, as Japan had seen in the prior 10 years. I took a lot of flak for that comment. Remember, we were just coming off of the Internet bubble bursting and the Y2K liquidity run-up wasn’t too far behind either. Everyone else thought the bottom was in and we were good to go. Interest rates were low. Etc.
Well, keep some of those thoughts in mind as we review not only 2011’s market action, but we look back at the last 10 years in the key indices.
Note that on these charts, I’ve drawn horizontal black lines from the opening of the chart to the end, so if you’re looking at a daily chart on the S&P for 2011, the black line is an easy way to see if the index was up or down for the year. If you’re looking at a 10-year weekly chart, well, you’ll see.
Let’s start with a look at the major indices and how they fared in 2011.
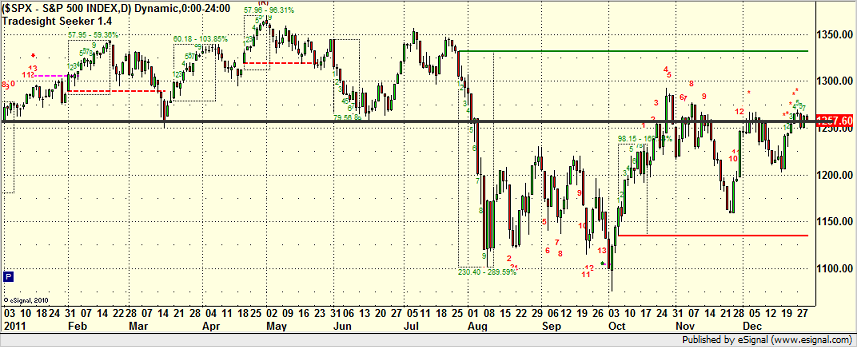
The flagship is, of course, the S&P 500, and this is pretty amazing. It closed 2010 at 1257.64 and closed 2011 at 1257.60. It’s hard enough for an index of 500 stocks to be “unch” (unchanged) for a day, but wow, lost 0.04 points for the year, amazing:
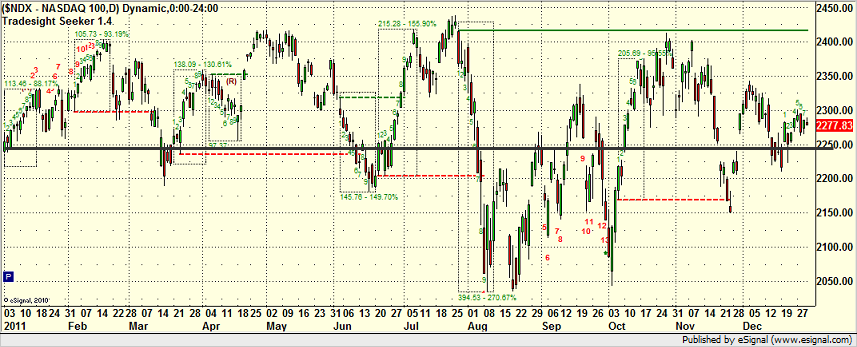
NDX did a little better, actually gaining about 30 points:
Biotechs were up:
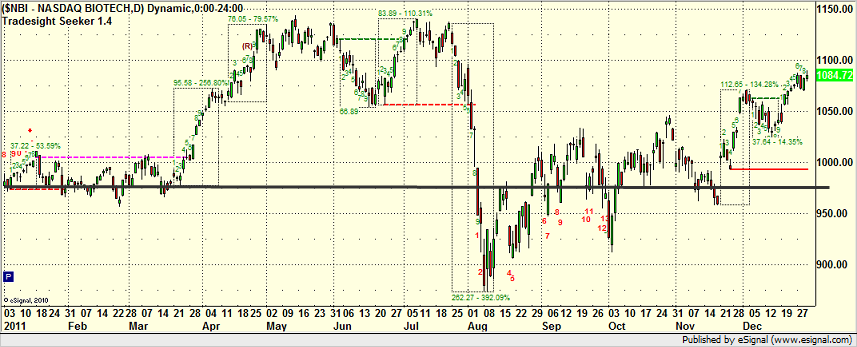
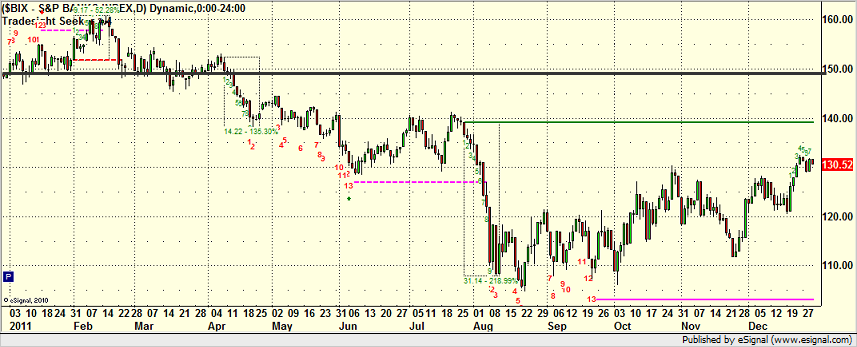
Banks were down (the old expression is that Banks and Biotechs heading in one direction lead the market, but clearly they weren’t in sync this year, so the market did nothing):
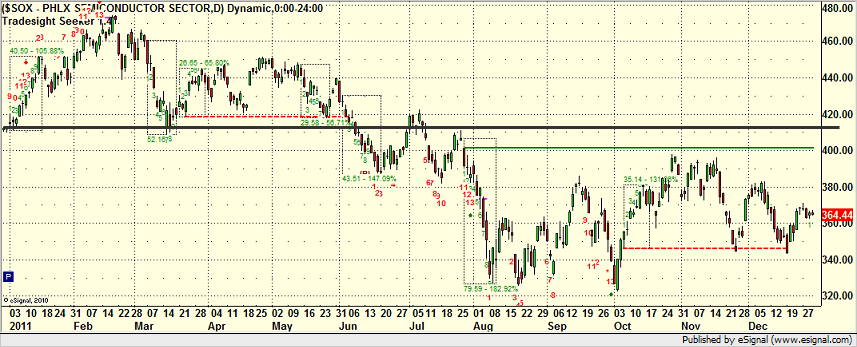
Semiconductors were down:
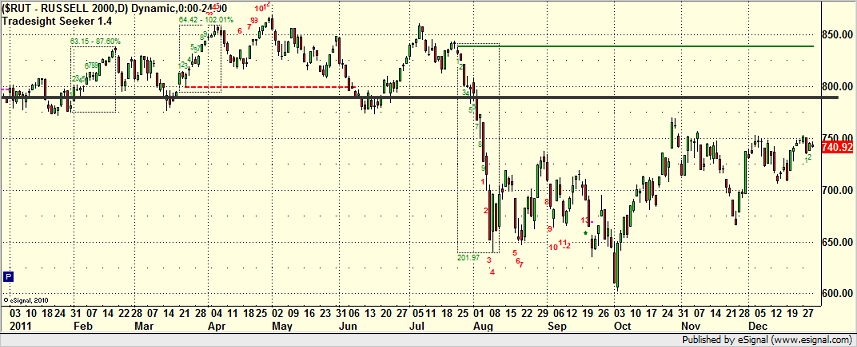
Perhaps the most disappointing action was in the Russell 2000, which is an important index for me because I love to play the sub-$10 liquid stocks when they are jumping a couple of points a week, but that didn’t happen either. Note that the Russell 2000 usually gains the most from October to April, and it’s been stuck since August:
Every day, we analyze the volume in the market after the first 30 and 60 minutes of trading. The reason is simple. When you have good volume, trading works better. Our threshold is that we like to see numbers that typically project out to over 2 billion NASDAQ shares on a day to be “above average,” and those are typically the days where trading is solid. Let’s take a look at the day-by-day NASDAQ volume data for 2009 to give us a starting point in this conversation:
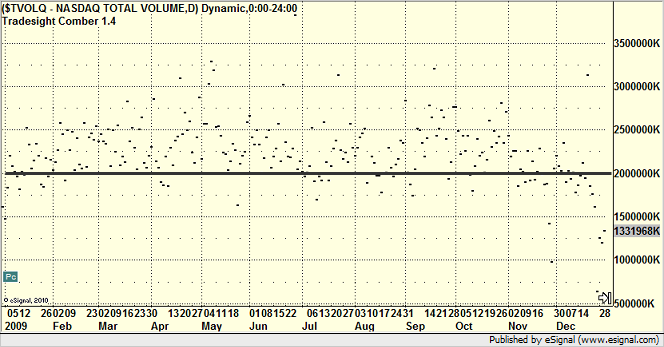
See how most of the days, volume was over 2 billion? Granted, you always get the volume drop-off for the last two weeks of the year because of the Holidays and end of year tax junk, but 2009 was solid for having trading volume over 2 billion shares most of the time.
How about 2010? Here it is:
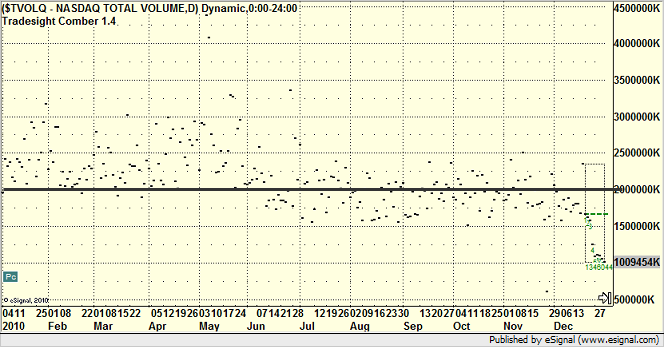
Remember that? The first half of the year was great, then summer hit, which sometimes brings us a drop in volume, but it never really came back. We had just as many days under 2 billion NASDAQ shares as over from June until the end of the year, with the usual drop again the last two weeks.
So, how was 2011 then?
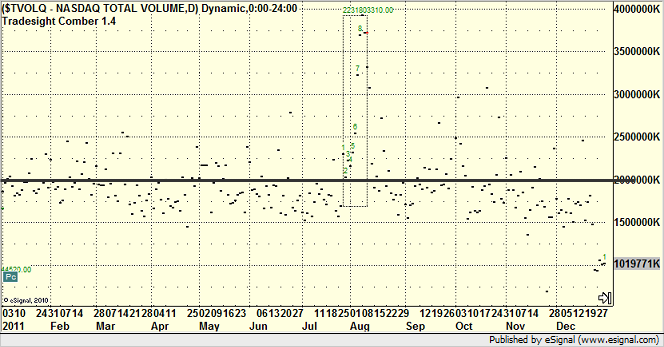
Ouch. Except for a spike for a few days at the start of August when the European situation looked bleakest, volume was pretty bad all year. I’d say less than 33% of the days over 2 billion NASDAQ shares. And December was horrible completely.
This is significant. We ended up having a great trading year, and I’ll cover some of the numbers in a bit, but we did it without the usual factor that drives good trading: good volume. Interesting.
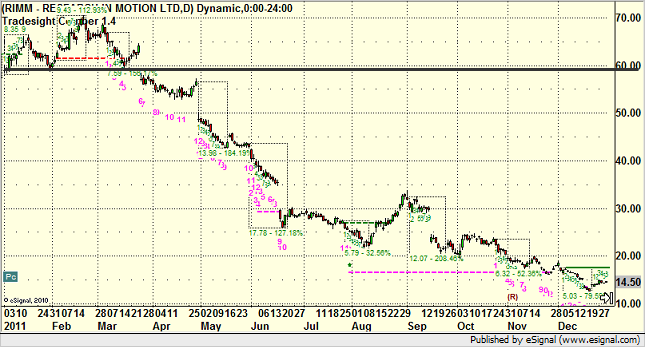
We always have certain stocks that we play over and over. That’s because they are solid movers and good technical traders. However, it is important in trading not to get attached to a symbol and not notice when it’s better trading days are behind it. We lost a few favorites this year, so let’s have a look.
RIMM dropped off the list. Let me know when it loses marginability too:
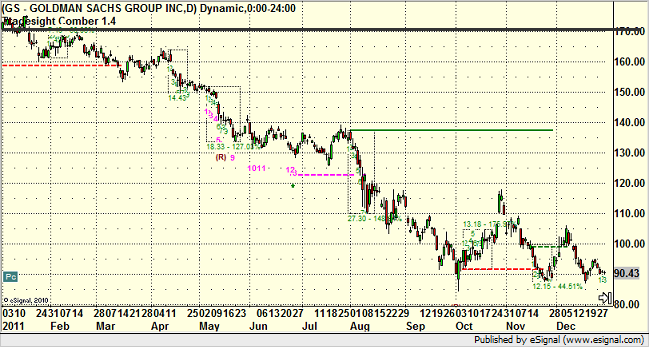
GS was in a steady decline all year too and isn’t the trader it used to be:
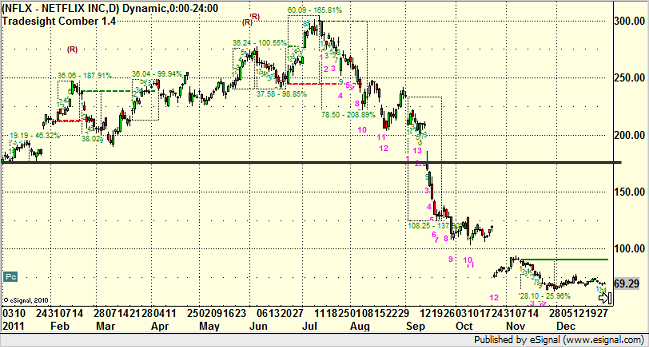
NFLX was a favorite of mine in 2010 and early 2011, but they shot themselves in the foot and probably aren’t going to regain the glory days of trading:
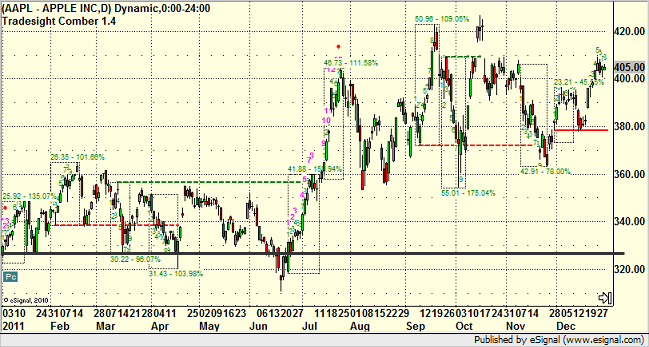
What still works? AAPL, despite the passing of Steve Jobs, was up:
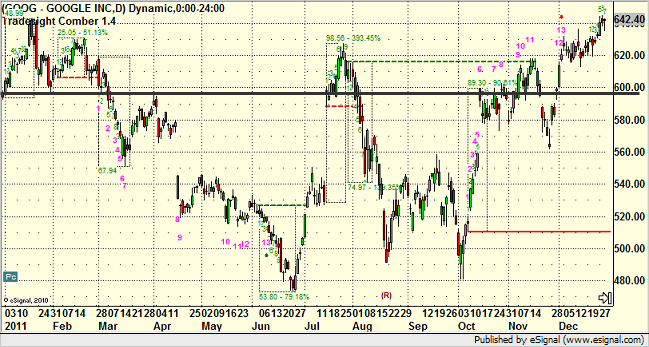
GOOG was great:
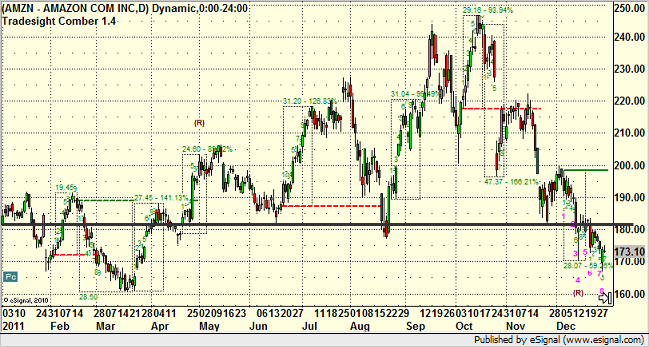
AMZN closed red but is still a strong trading stock:
We will be adding new common traders to the group in 2012 for sure.
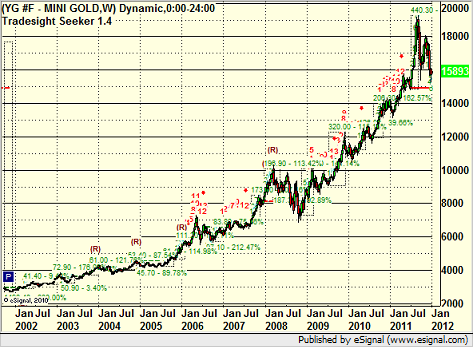
Gold continued its climb this year (here’s the last decade) but came back a bit in the back end of the year, the biggest drop it has seen in a while on a percentage basis:
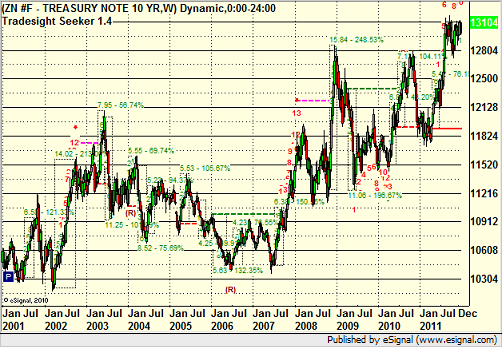
Bonds made new highs this year as well:
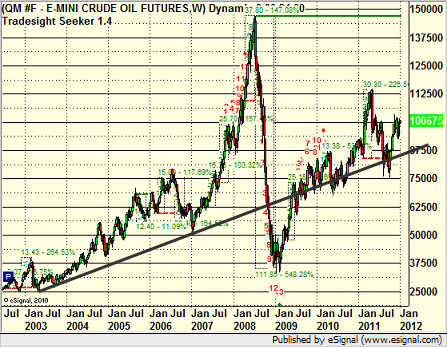
Here’s 10 years on oil with a clear trendline (even if it has been all over the board during the decade):
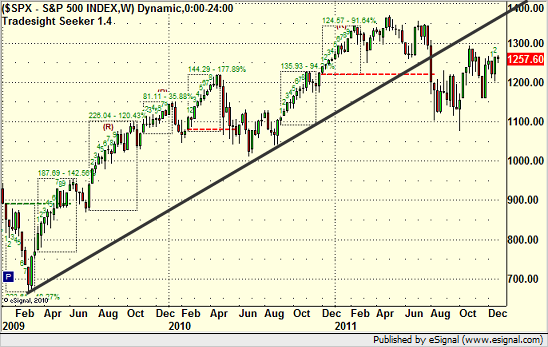
Speaking of trendlines, the weekly charts of the S&P and NDX show that we broke multi-year uptrends late in 2011. Here’s the S&P:
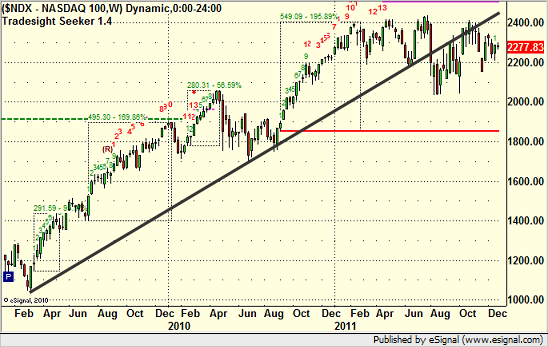
And NDX:
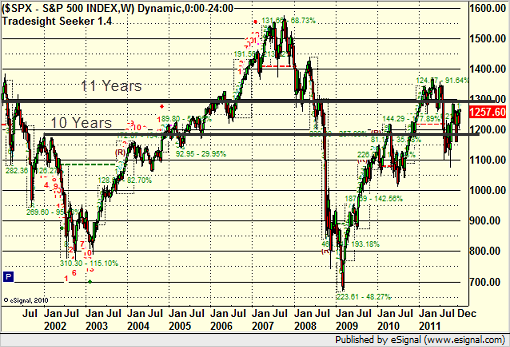
Finally, as I alluded to at the top of this report, let’s have a look at the last decade on the S&P and NDX. These are actually 11-year weekly charts, but I’ve drawn horizontal lines showing the last 10 and 11 years of action on each.
Here’s the S&P 500. 11 years = down 30 points or so. 10 years = up 50 or so:
Here’s the NDX. 11 years = unchanged. 10 years = up a few hundred at least:
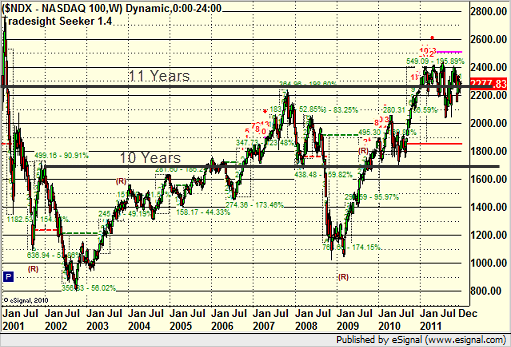
I would call that a Lost Decade. Class dismissed.
This year, we posted our daily stock trading picks…every single one that triggered…into the Market Blog on the site. You can read them all here. From that, I actually tracked our results.
We averaged just under 5 trades per day that triggered with market support at the time. That’s 1238 triggers. 32% of them lost. 36% of them worked enough for a partial and that was it (basically washes out the losers); INSERT INTO `wp_posts` (`ID`, `post_author`, `post_date`, `post_date_gmt`, `post_content`, `post_title`, `post_category`, `post_excerpt`, `post_status`, `comment_status`, `ping_status`, `post_password`, `post_name`, `to_ping`, `pinged`, `post_modified`, `post_modified_gmt`, `post_content_filtered`, `post_parent`, `guid`, `menu_order`, `post_type`, `post_mime_type`, `comment_count`) VALUES and the rest were all bigger winners. Not a bad result at all. That’s how we teach people to trade. You don’t need to run 50 trades a day, and if you do trade management right, you don’t need to win 80% of your trades (because no one does) to have a solid year. Obviously, the better volume periods are the better trading periods, and this year was a little lighter on those days, but it didn’t have a serious impact.
I’m not going to do forward projections about the indices here. That’s for another article. This one was just about recapping 2011 and putting it to rest. It was a solid year for Tradesight again. No complaints.
Tradesight Stock End of 2011 Summary
January 3, 2012
|In Tradesight