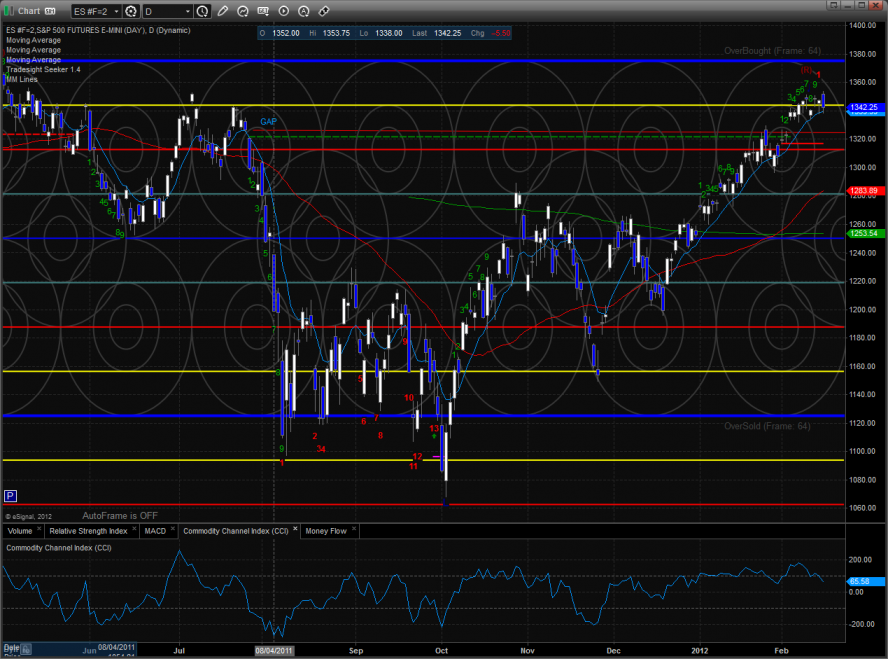
The ES registered a range high distribution day with price recording a new high, but settling lower on the day. Note that while this leaves a sloppy candle on the chart, this was not a classic key reversal day where price settles below the low of the prior candle. Keep a close eye on the short term trend defining 10ema (blue).
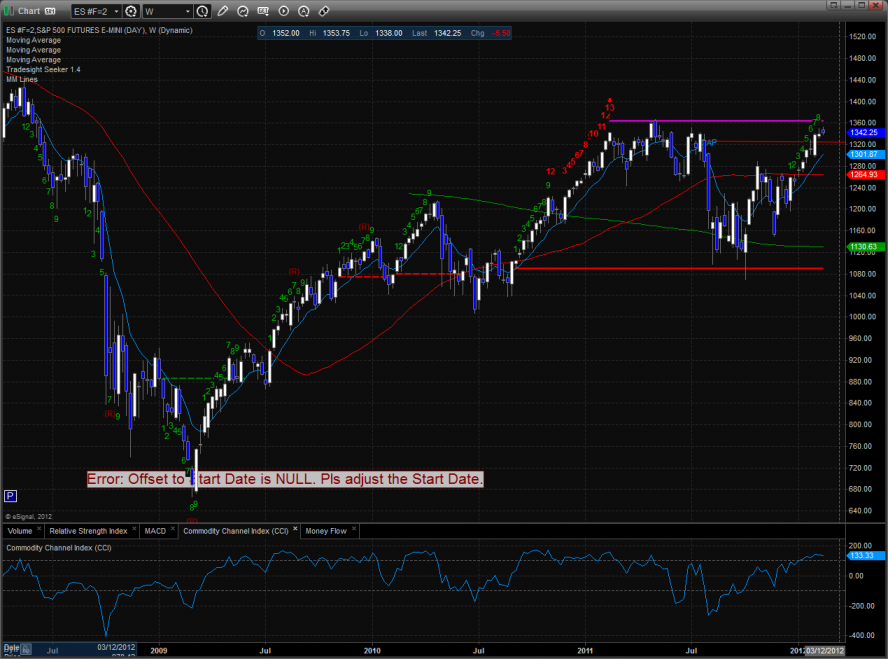
Below is a weekly chart of the ES that clearly shows the importance of this price area. There are a number of technical features. The chart is working on 9 weeks up in the Seeker setup and the prior sell signal is still in effect because there was no downside 9 bar setup and the risk level hasn’t been broken.
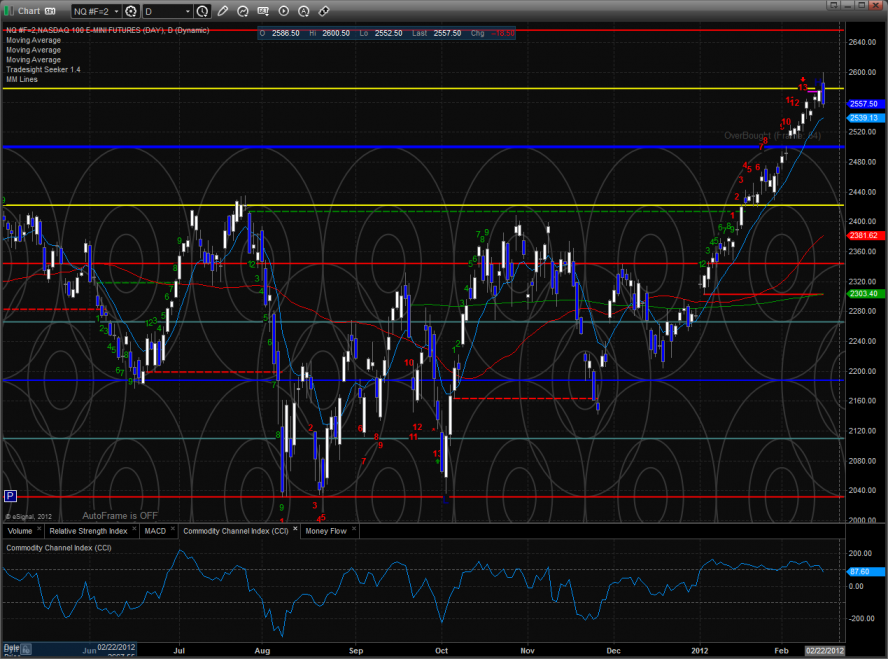
The NQ made a new high on the move but closed lower on the day. Like the ES it was a nasty candle but not a key reversal candle. The 800lb gorilla in the room, read AAPL, did record a classic key reversal day and continued downside momentum will weigh on NQ like a Nantucket sleigh ride.
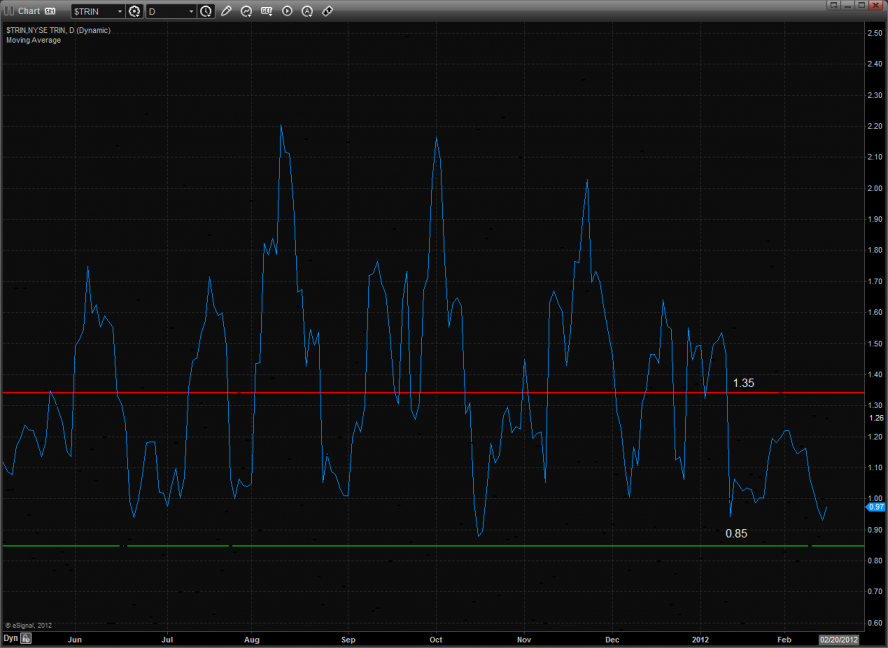
The 10-day Trin is close but has not reached the overbought threshold.
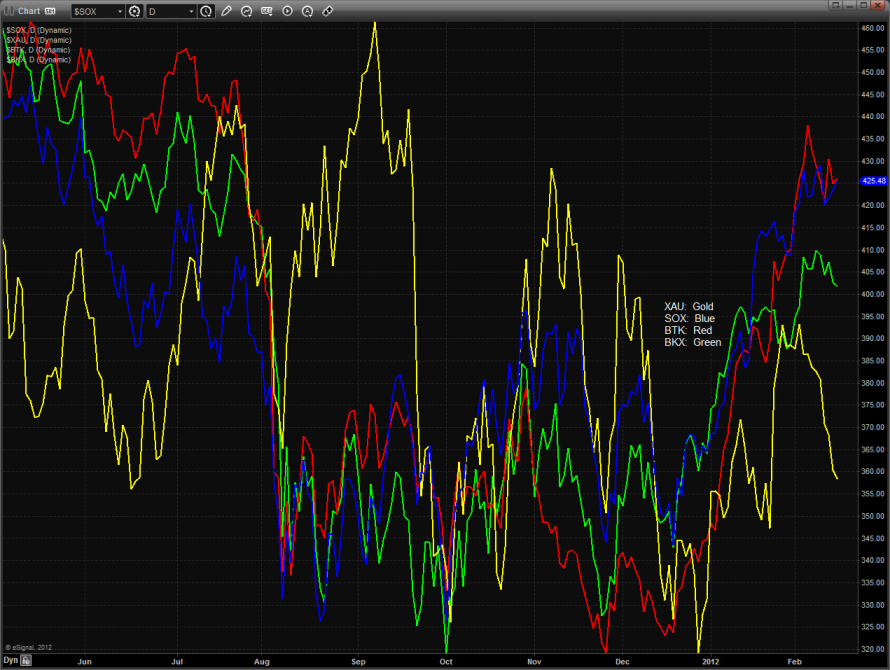
Multi sector daily chart:
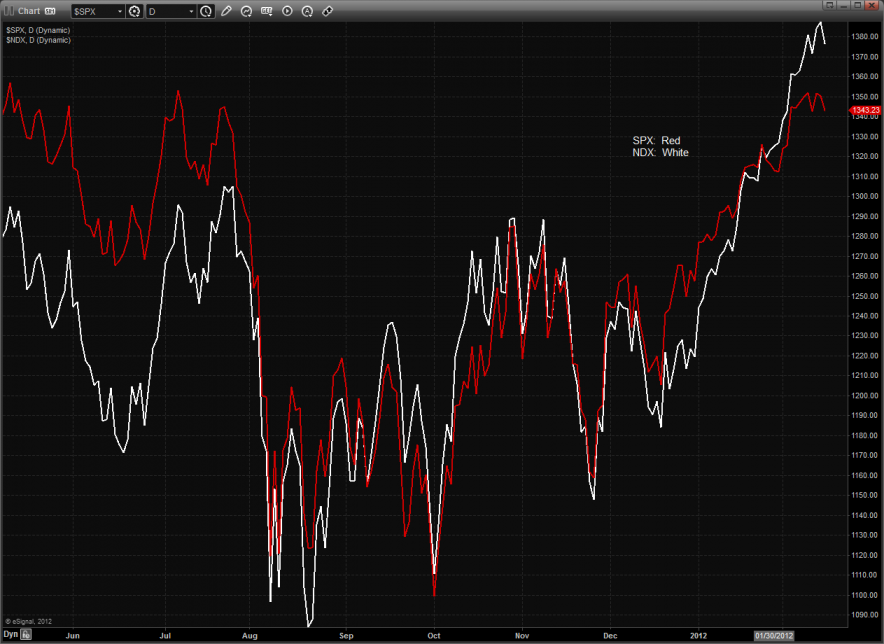
It’s time to start monitoring the relative performance of the NDX vs. the SPX very closely. If the NDX becomes relatively weak then stocks are ripe for a correction.
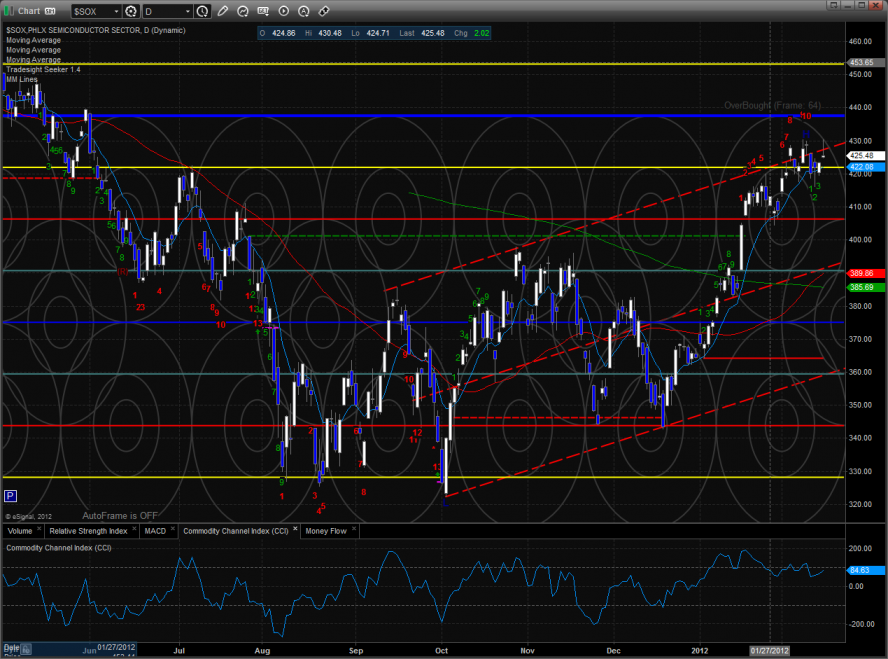
The SOX was the top gun on the day and recorded 11 days up in the Seeker count.
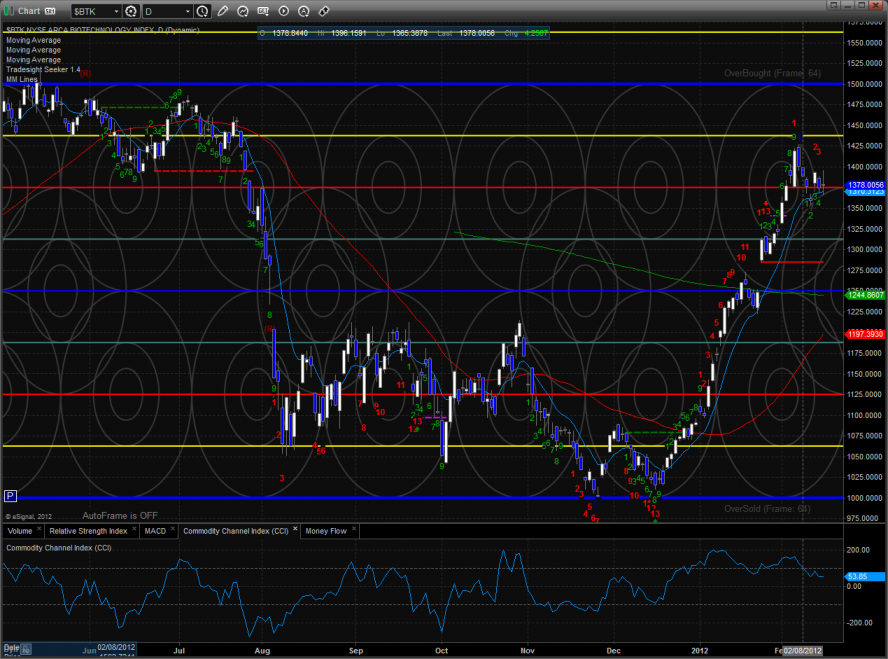
The BTK was higher on the day. Set an alarm for a break under the 10ema.
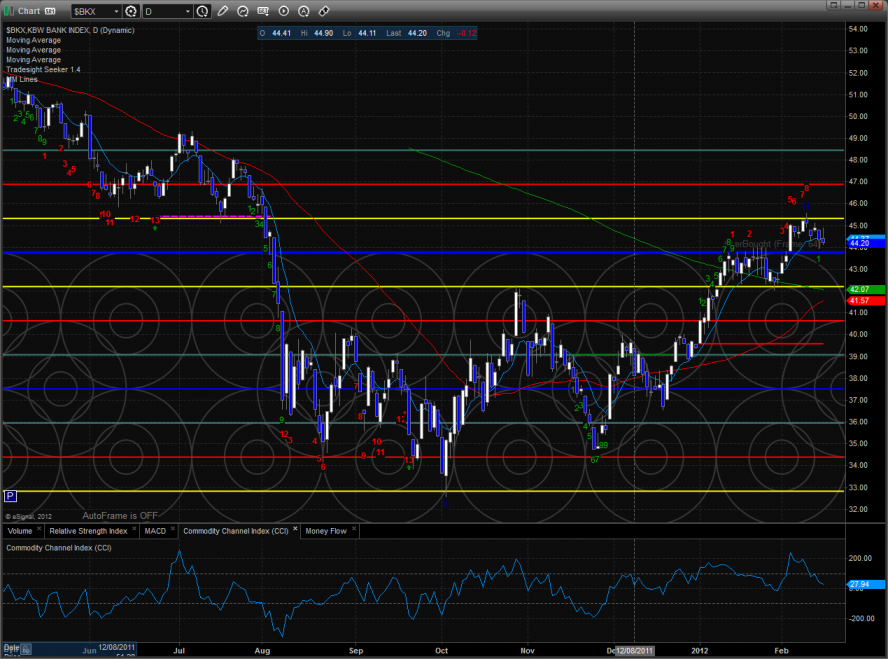
The BKX was flat on the day. The level to watch is the 8/8 Gann level which was previously resistance and now critical support.
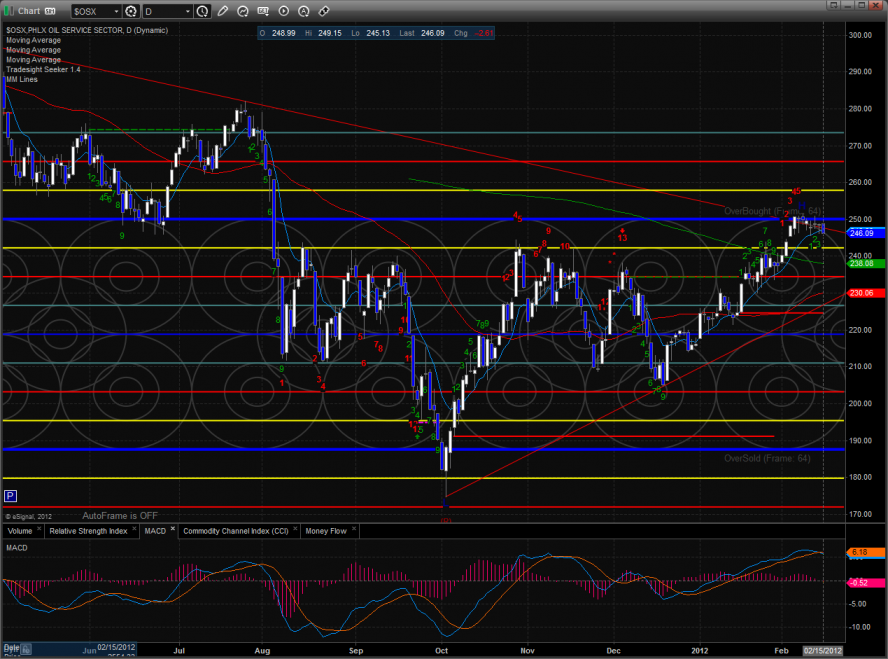
The OSX looks like it’s ready to roll. Price settled below the 10ema and the MACD is now showing sell.
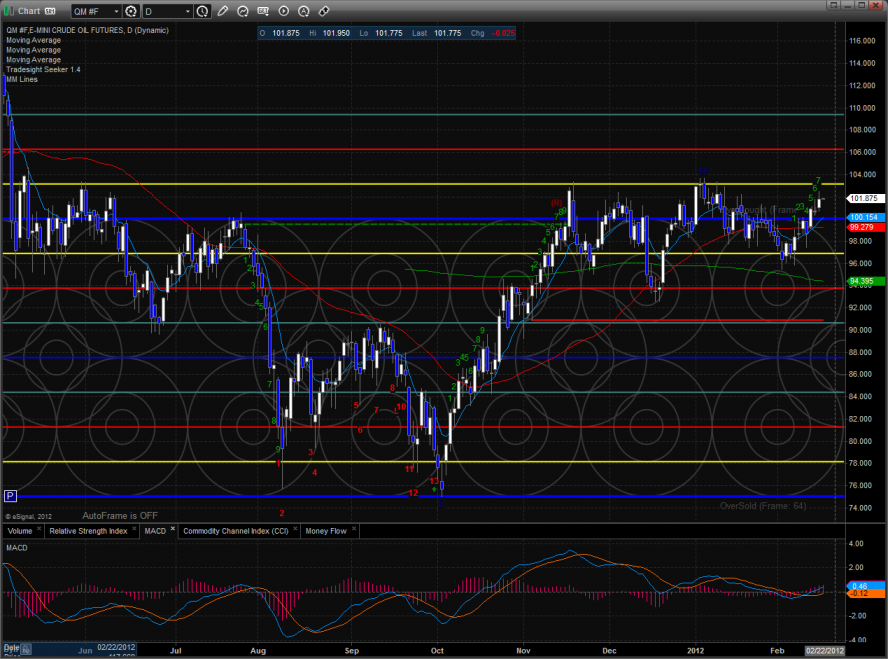
Oil:
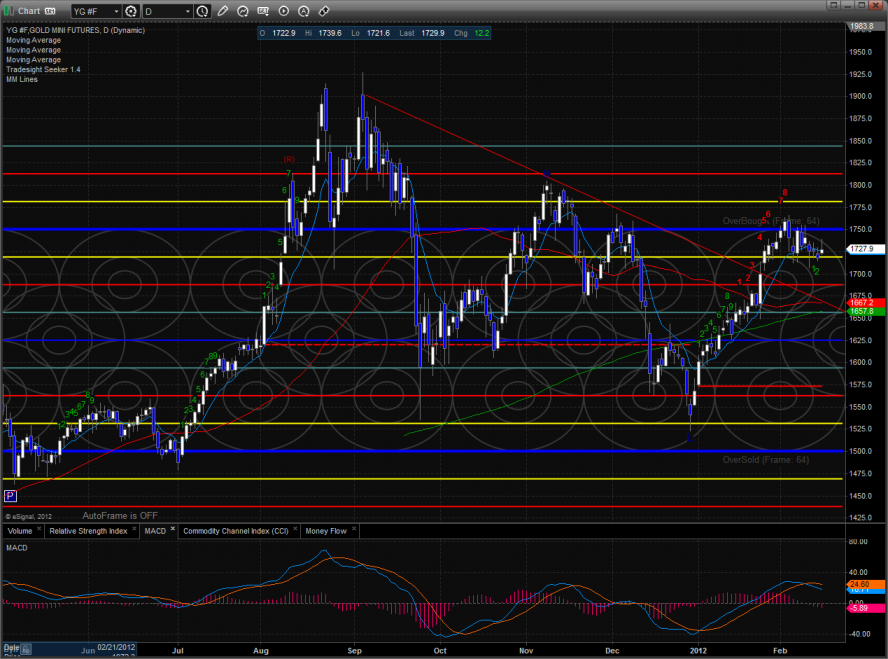
Gold:
Tradesight Market Preview for 2/16/12
February 15, 2012
|In Tradesight