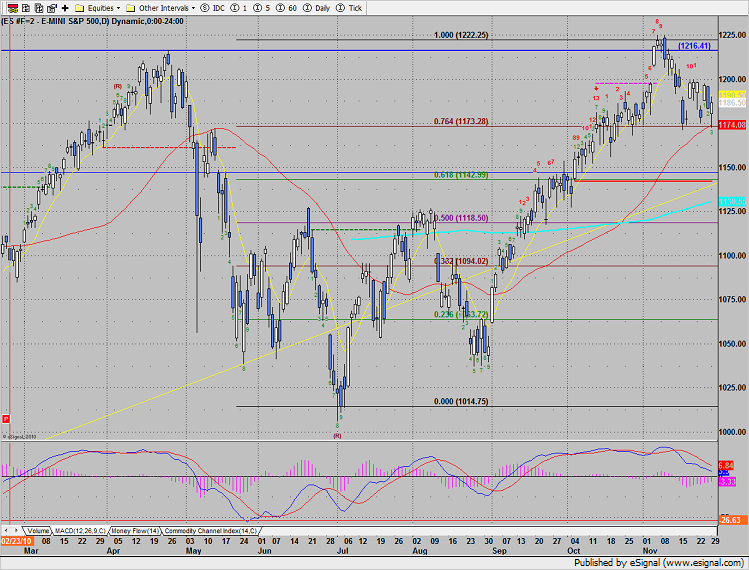
First touch—Monday was the first interaction with the 50dma (red) since the first trading day in September. This will be an important area of interest for days to come. The 50 should provide support when it’s first tested and would be a strong confirmation of a change in trend if lost. There are a couple of ways to look at the recent trading action. The bull case is that price is consolidating in the area of the prior high (April) possibly making a handle to breakout. The bear case is that the “look see” above the April high was a failure and the price pattern is making a head and shoulders supported by the MACD sell condition. Time will tell but for now the 50dma is the big man on campus.
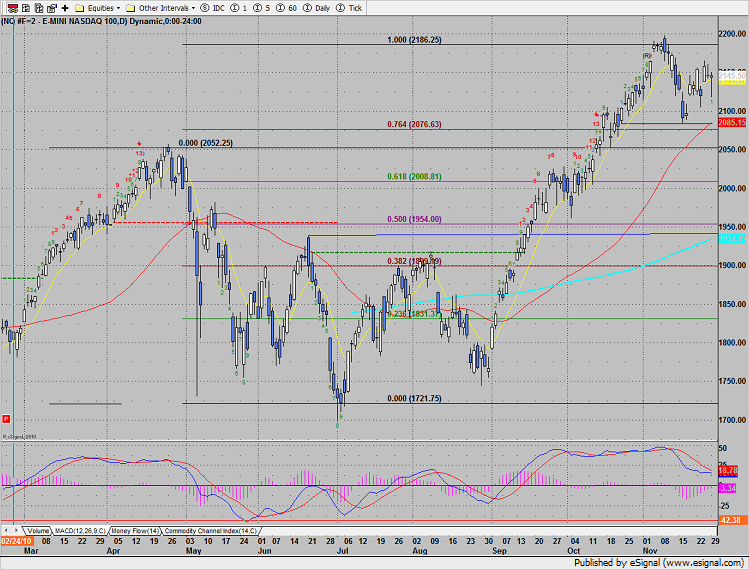
Naz closed the gap from last week and was unchanged on the day. Note that there is still one open gap open just under the 2100 level.
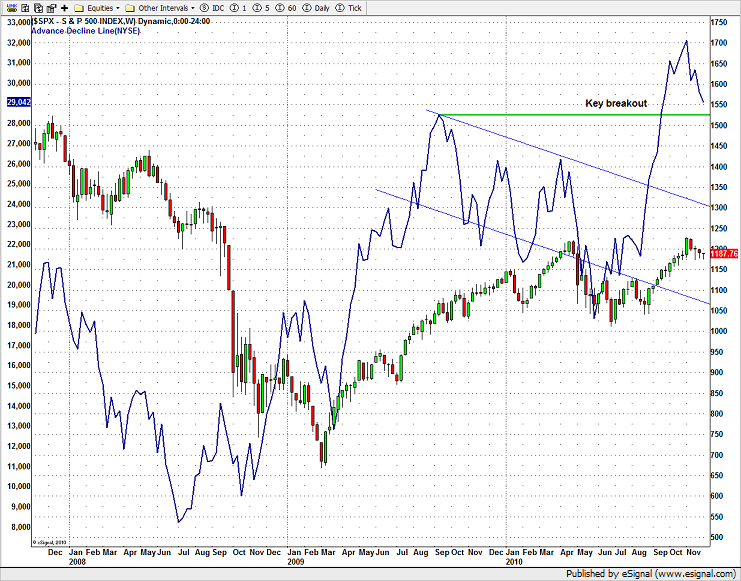
The NYSE cumulative A/D line took a pretty good whack last week. The current area of interest is the breakout level at about 1525. This is key support and the loss of 1525 would indicate a failure.
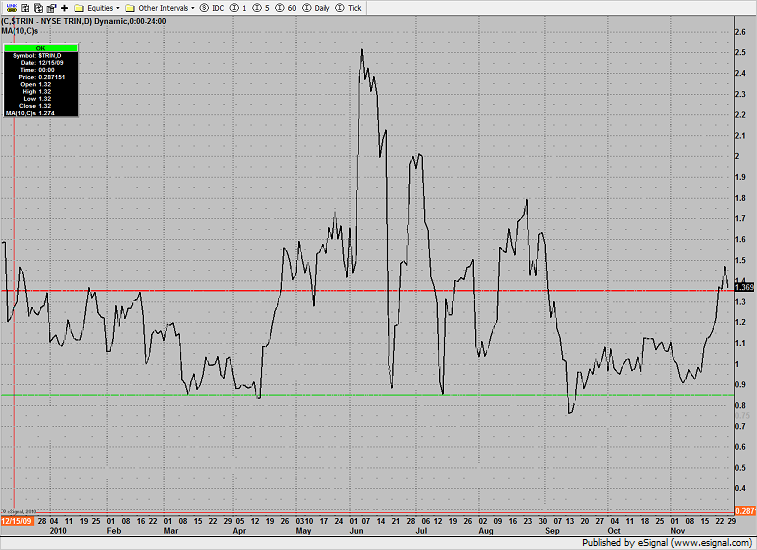
The 10-day Trin remains oversold at 1.36 which implies that the market has available energy for upside movement.
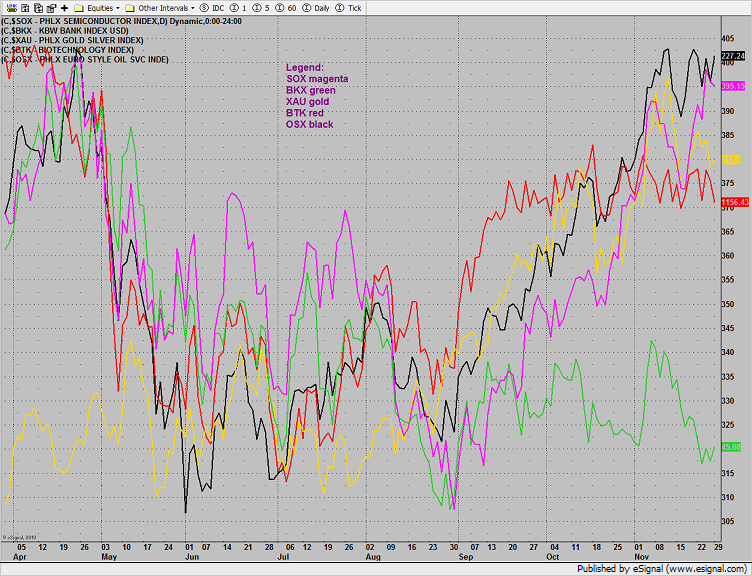
Multi sector daily chart:
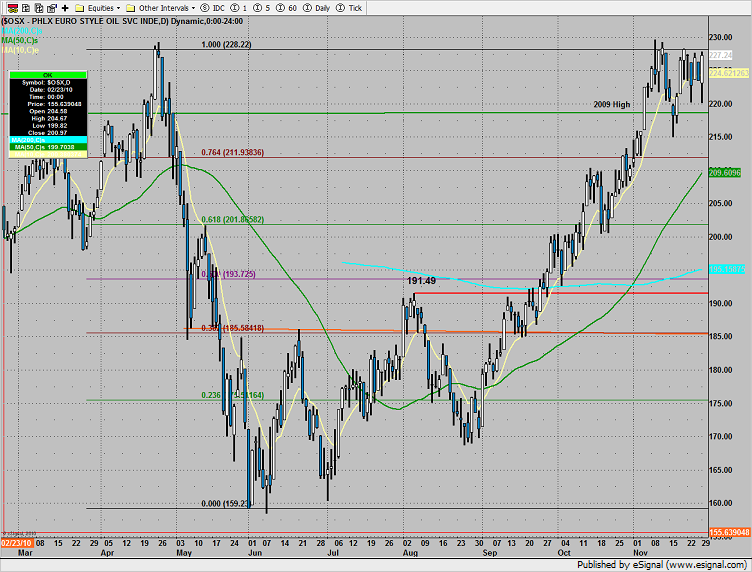
The OSX was the top sector on the day. The pattern still has cup and handle potential so set an alarm for a break over 230.
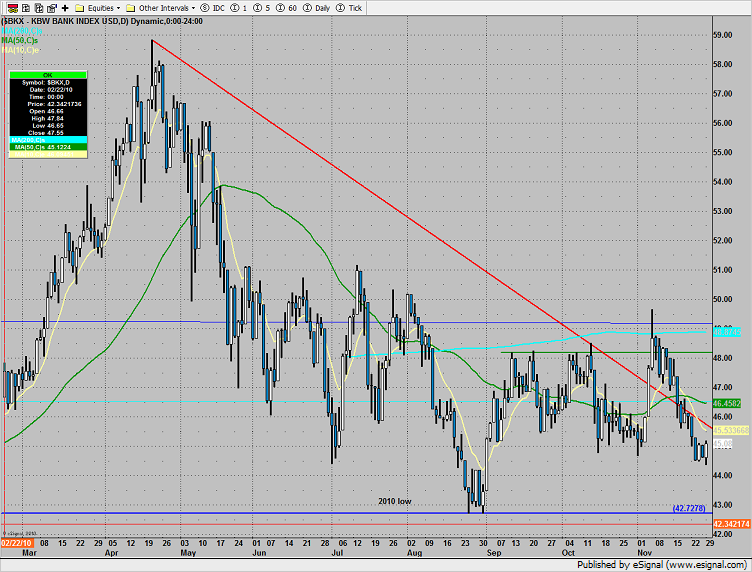
The BKX was stronger than the market, finding support near the old lows. Price has been boxed up for about 4 days so a breakout of the pattern could be strong.
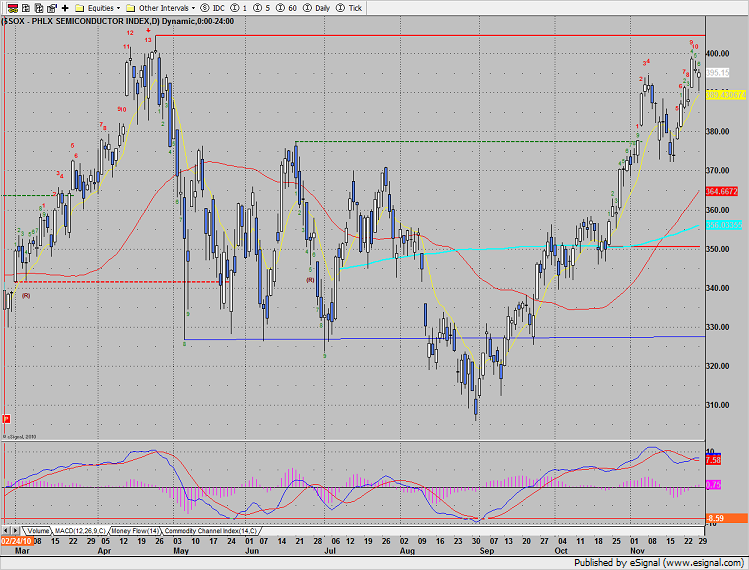
The SOX was slightly higher on the day gearing up to challenge the old high. Note the maturity of the current SEEKER countdown at day 10.
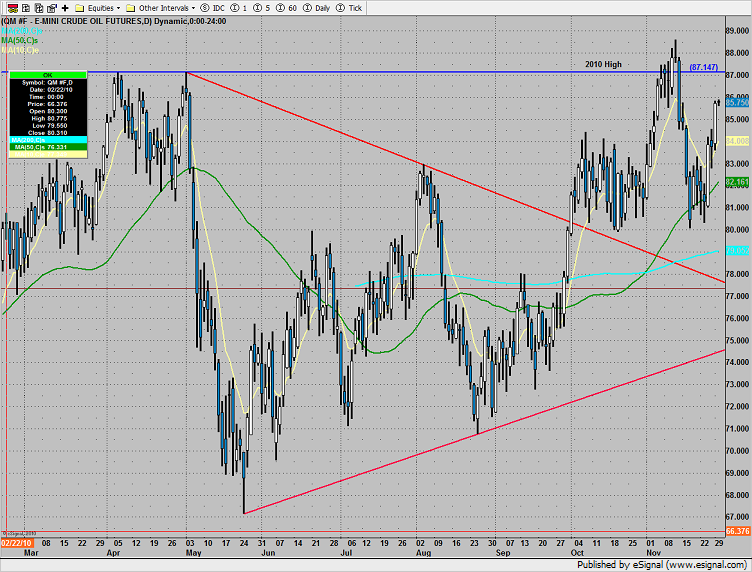
Oil was very strong and will surely breakout if the OSX makes new highs:
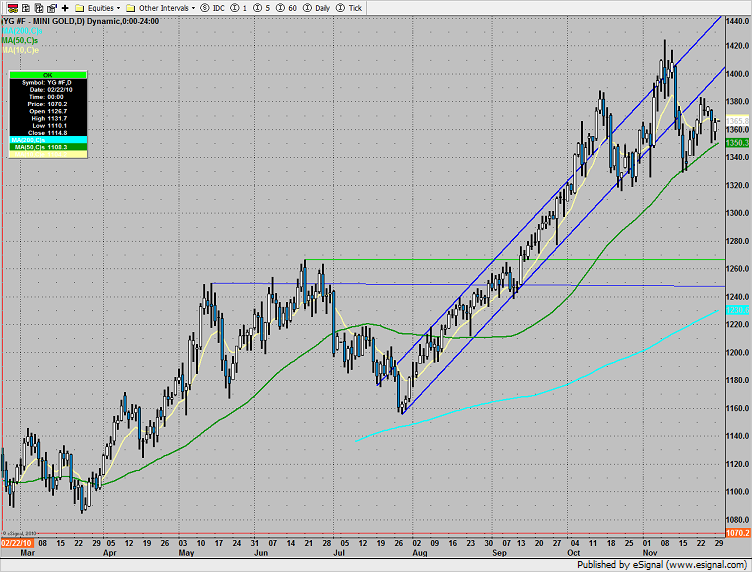
Gold continues to hover perhaps tracing out a head and shoulders. The first clue will be the loss of the 50dma.
Tradesight Market Outlook for 11/30/10
November 29, 2010
|In Tradesight