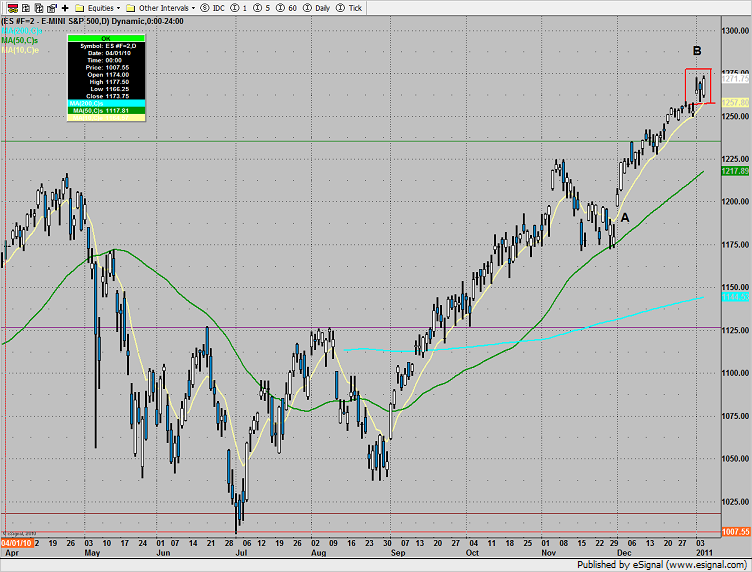
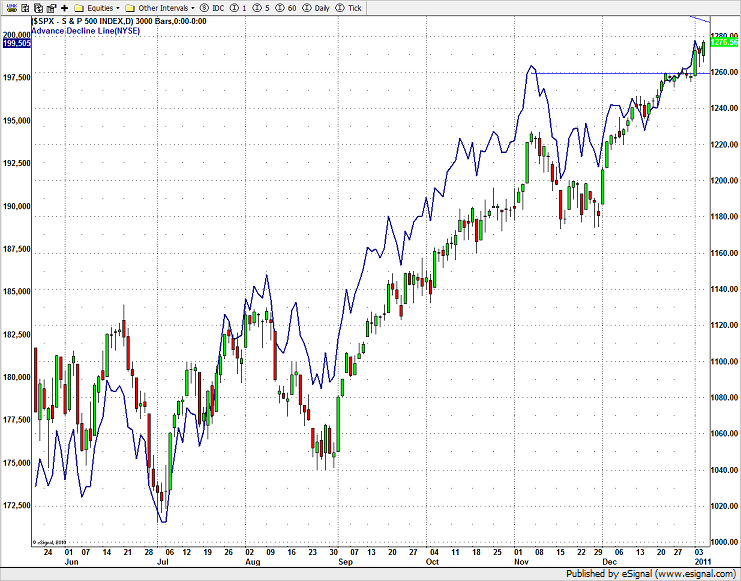
The January effect is a widely known phenomenon that proposes as goes January, so goes the rest of the year. It’s kind of a grand assumption, very long term in perspective, and its accuracy and usefulness is debatable. There is a much shorter time frame January phenomenon that is technically more potent. The current design of the broad market is one of a strong upward bias that has not had any corrective action since the beginning of the current impulse on December 1, 2010 (point A). Price has advanced approximately 75 points without any meaningful test of the bulls conviction to their long positions. This advance is often viewed as an extension of the seasonal December rally and leaves the pattern ripe for correction. The micro January effect goes as follows: When the preceding December has been upwardly biased and the first three days of the following January is up, more times than not, the bias will turn negative sometime on or after the fourth trading day of January.
Note that in the daily chart of the SP futures below, price has met the criteria for the micro January effect and at point B on the chart, price is at range high and stretched well above the 10ema. If a downward bias develops, avoid buying the first break, the money to be made should be on the short side.
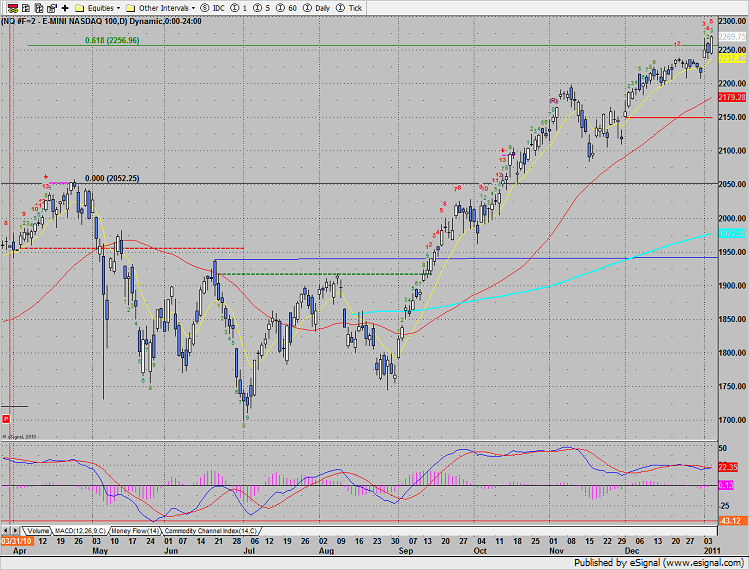
Naz closed at a new high and like the SP, has the same micro January condition described above.
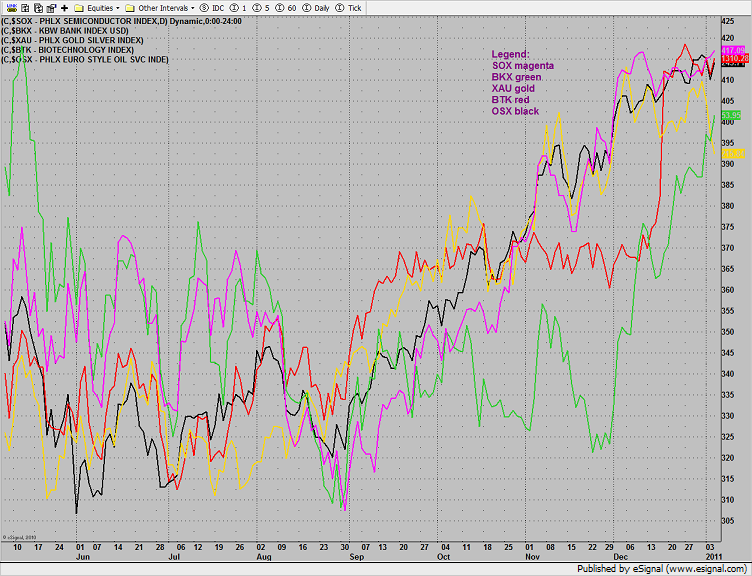
Multi sector daily chart, note the relative weakens in the XAU:
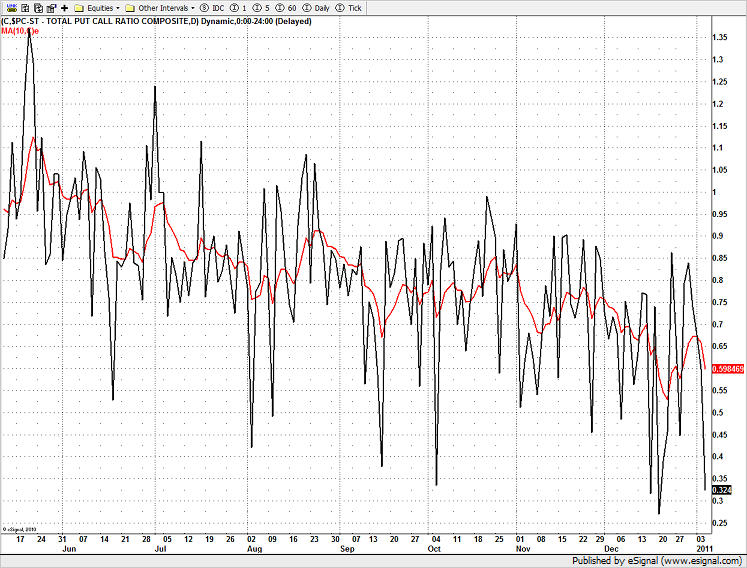
The put/call recorded a very low close. This is an indication of extreme complacency by the bulls.
The cumulative NYSE A/D line is no longer leading price in the daily time frame. There is no divergence present, but the broad market doesn’t have the internal safety net that it enjoyed for the majority of the advance from July through December 2010.
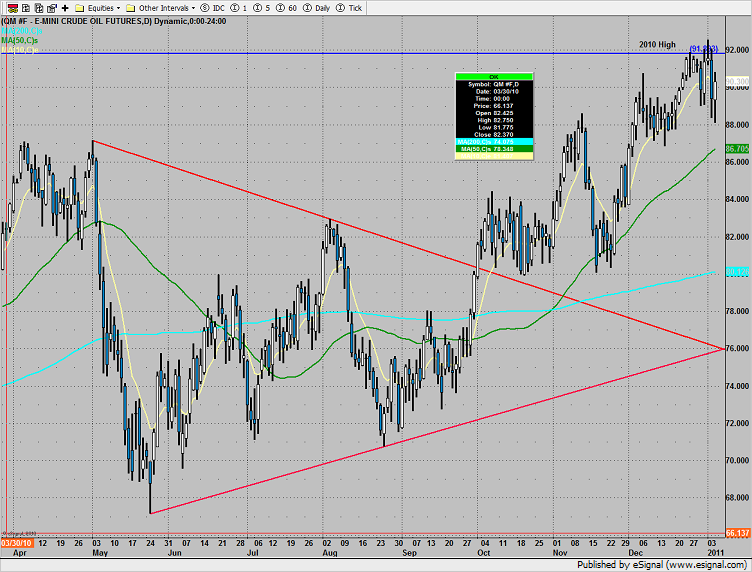
As discussed in the previous report oil was not expected to follow through to the downside Wednesday and it did not. Oil was higher on the day but unable to reclaim the 10ema or the 2010 high. The next breakdown should be sold and aggressive traders can look to sell rallies.
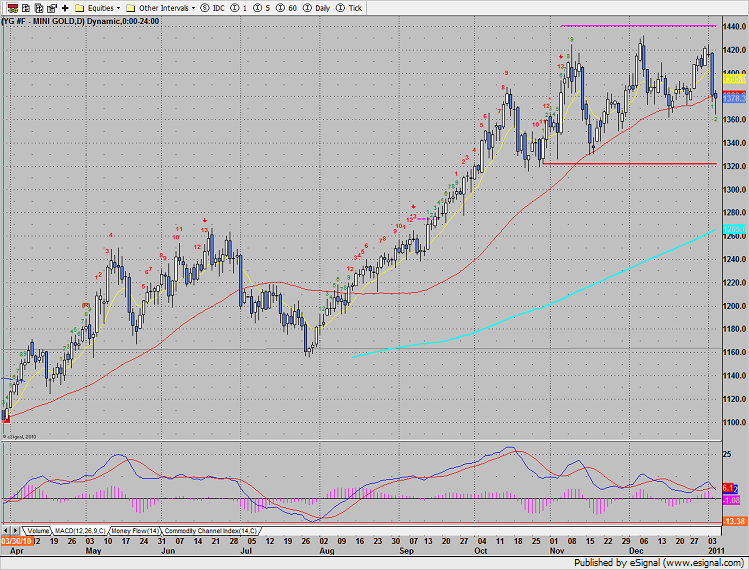
Gold was lower on the day and for the first time since August settled below the 50dma. The Seeker sell signal is still active. A break under 1360 puts 1325 in play.
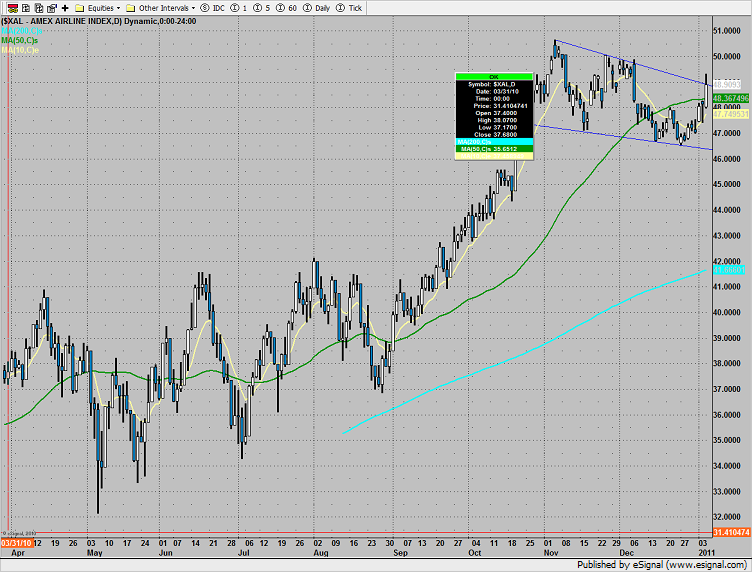
XAL was the top performing sector, settling right at the top of the falling wedge pattern. Overweight this sector for long ideas.
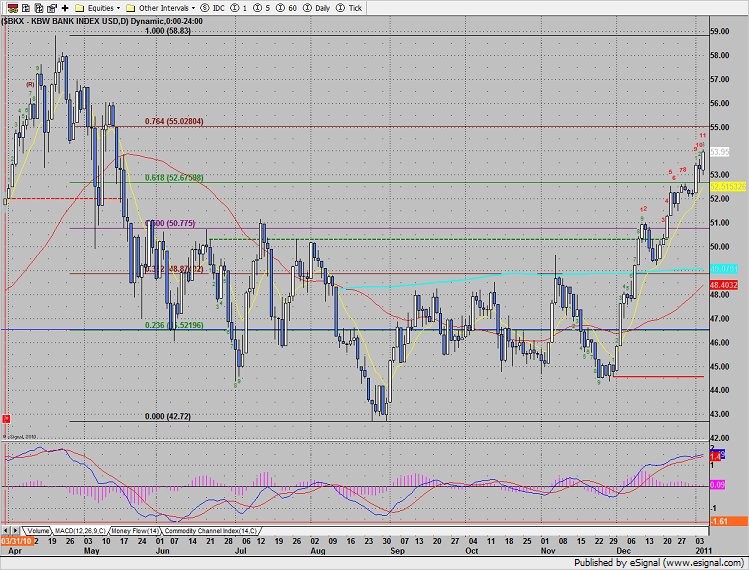
The BKX outperformed the broad market and is closing in on the next fib target. The seeker count is on day 11 of the 13 needed for an exhaustion signal.
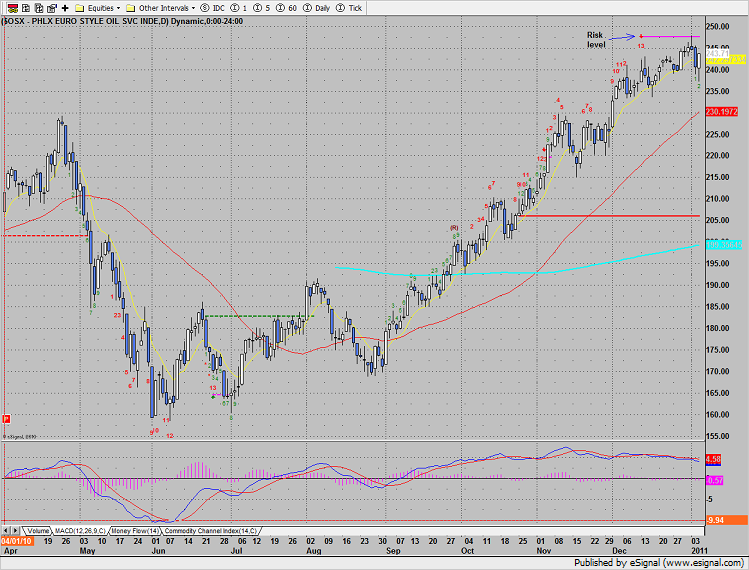
The OSX was higher by 3 on the day but is in the beginning of some corrective activity until the exhaustion signal risk level is exceeded.
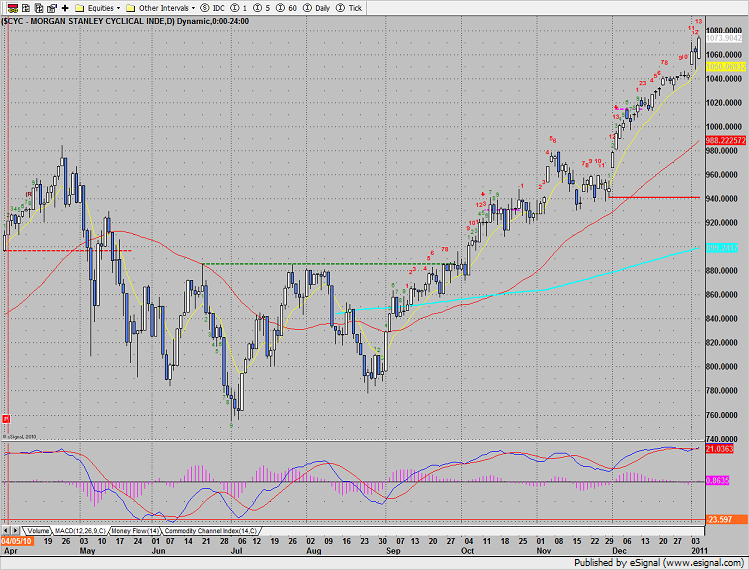
The CYC cyclical index registered a Seeker 13 exhaustion signal.
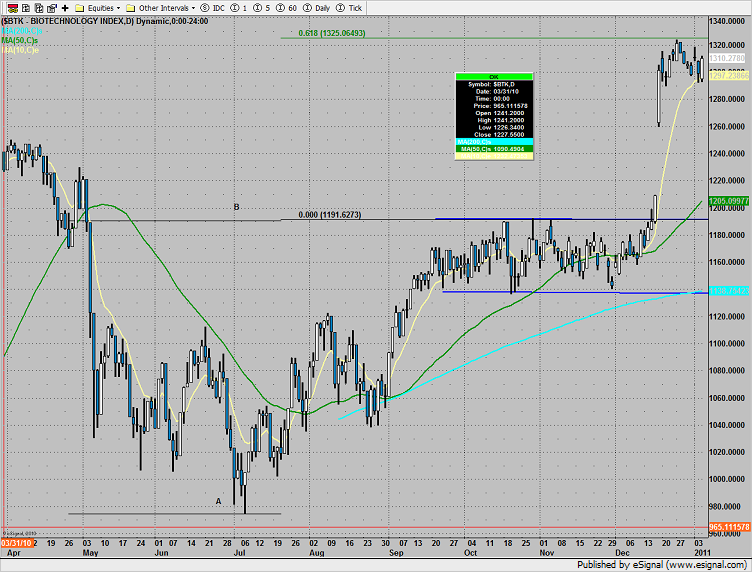
The BTK remains rage bound:
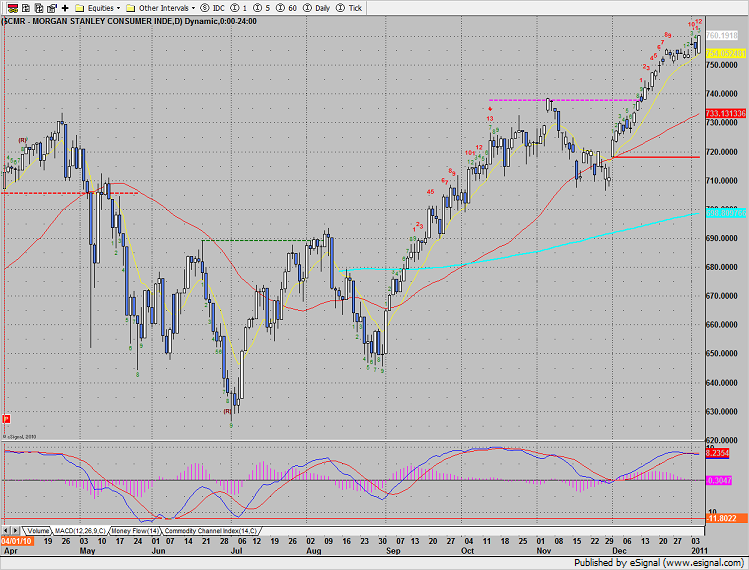
The CMR consumer index recorded 12 days up, one proper candle from an exhaustion reading.
The SOX is moving sideways consolidating the recent breakout. Nothing new until the range is broken.

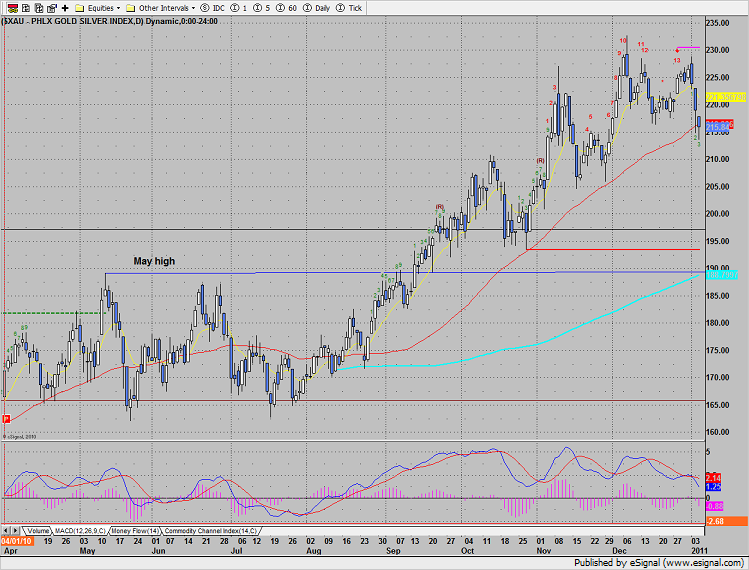
The XAU was last laggard. Price closed below the 50dma and is just beginning to feel the effects of the Seeker sell signal.
Market Preview for 1/6/11
January 5, 2011
|In Tradesight