One of the tools that we follow closely is the Make or Break projection lines in e-Signal. This tool can be used to give you powerful targets on any trading symbol based on the most recent swing high and swing low. The tools plots price and time targets that are support or resistance if they are achieved.
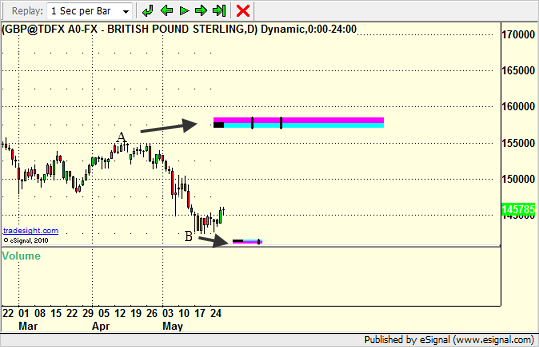
Sometimes, you can have MoB lines in both directions that are spaced far enough apart that both can hit. Let’s take the example of the GBPUSD back in March. In this daily chart, I’ve drawn the MoB lines off of the swing high at A, which projects out as you can see, and the swing low at B:
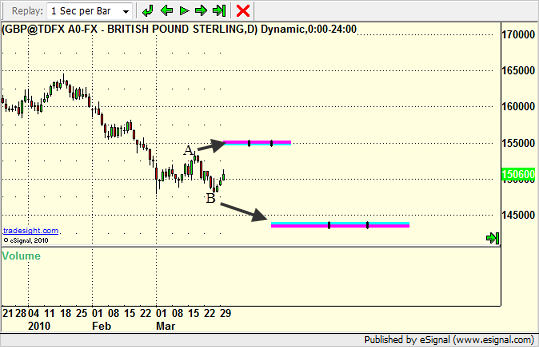
In this case, it is potentially possible that both lines could be hit. The ideal calculation is that the price will hit during the bar itself (not before or after); INSERT INTO `wp_posts` (`ID`, `post_author`, `post_date`, `post_date_gmt`, `post_content`, `post_title`, `post_category`, `post_excerpt`, `post_status`, `comment_status`, `ping_status`, `post_password`, `post_name`, `to_ping`, `pinged`, `post_modified`, `post_modified_gmt`, `post_content_filtered`, `post_parent`, `guid`, `menu_order`, `post_type`, `post_mime_type`, `comment_count`) VALUES with a real focus between the two black lines. Since these lines are spaced out, it would be possible, though certainly not necessary, that both could hit. Remember that the point of a MoB is a “potential” target if the market heads that way, not a likelihood that it will head that way.
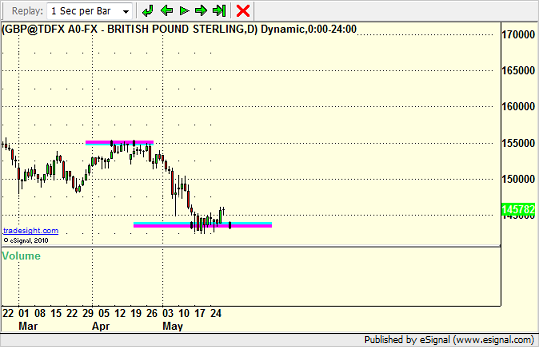
As we moved into April, take a look at where price went:
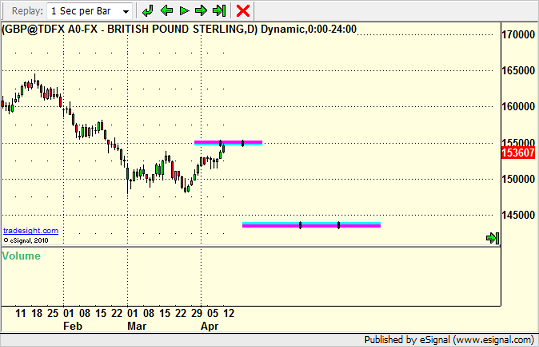
GBPUSD smacked right into the MoB between the two black lines, as projected. And as the month continued, it used that line as specific resistance:
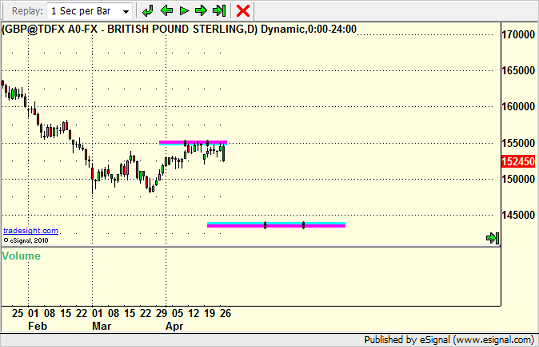
The question becomes, will that resistance point finally break, or will the trend resume? It is also important to note that the lower MoB was a thicker, making it a stronger projection. Here’s the movement in May:
Right to the lower MoB…and…during the ideal time target between the black lines. Very interesting when you consider all of the news over the last month that a level projected in March could be hit so precisely.
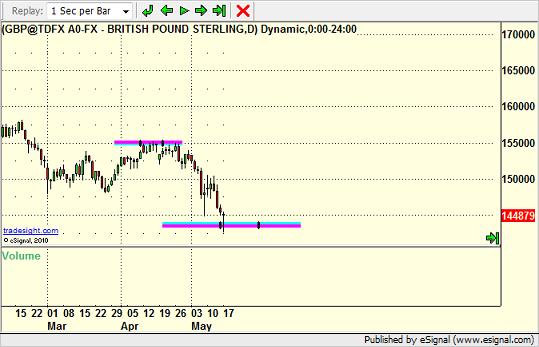
The rest of the month through today was spent using that MoB as support:
So now that we have new swing highs and lows, where are the new MoB projecting going forward? This is a little more interesting of a story. Have a look:
This time, both of the projections play out against the same timeline. The LOWER projection is much smaller and shorter, and obviously easy to hit. The upper line in general could be hit and would represent a change in trend if it were over the longer haul. But it isn’t likely possible (although it is theoretically possible) to hit both in their ideal time projections, which makes this a battle.
We also are on the verge of a 13-bar sell signal on the US Dollar Index, which would be a powerful reversal signal if it fires in the next week or so. That would definitely increase the odds of a change in trend and point to that upper line hitting. We will continue to monitor.
You can follow us on Twitter for more details by clicking here, or take a free or full trial to our various trade calling and education services here.
A Tale of Two MoBs
May 28, 2010
|In Tradesight