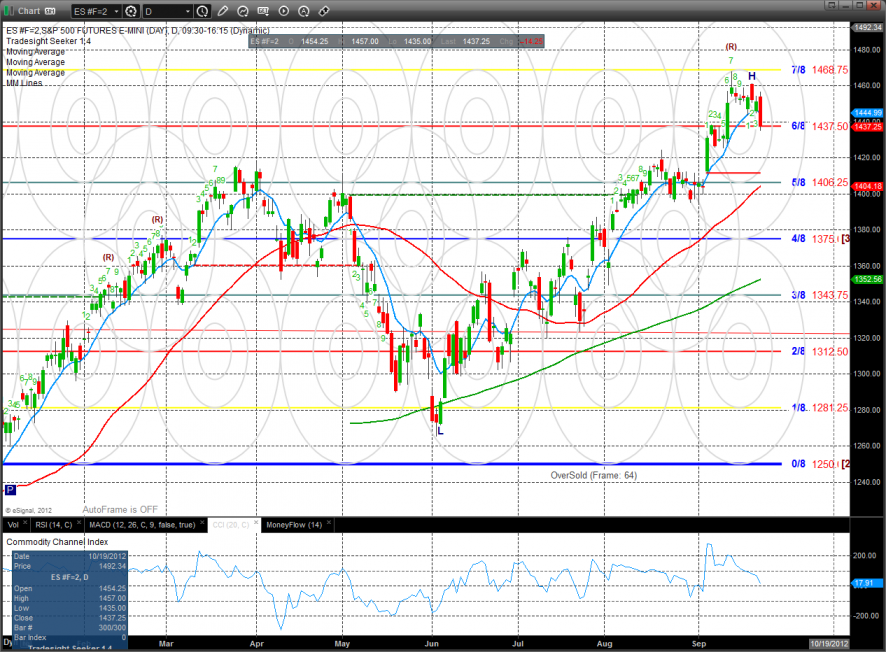
The ES lost 14 on the day decisively settling below the 10ema, turning the short-term trend negative. The next key support is very obvious on the chart where the Q1 highs align with the active static trend line.
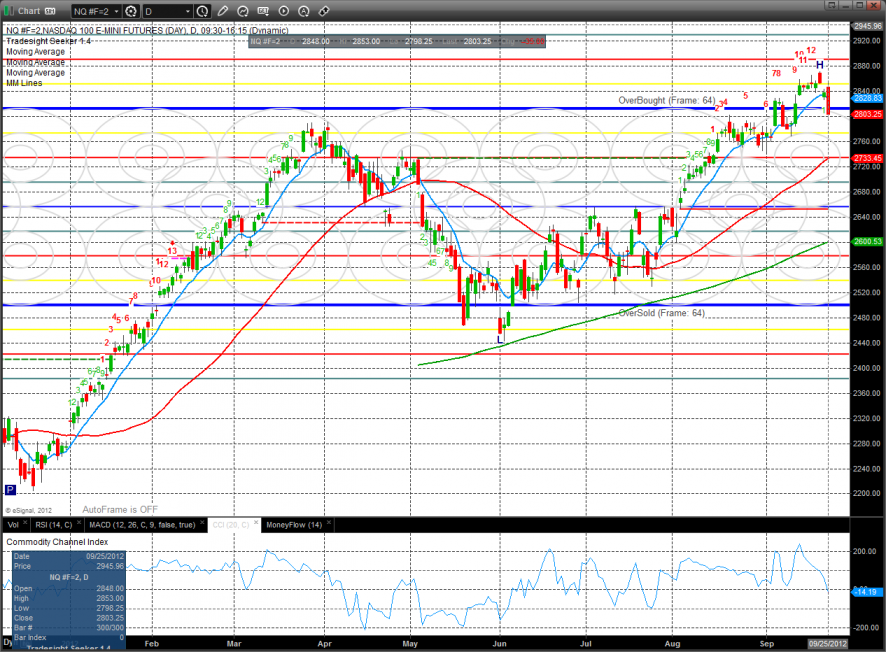
The NQ futures were weaker than the broad market and already are much closer to the key Q1 highs. Note that the pattern is 12 days up in the Seeker countdown so a bounce an retest of the highs will likely fail.
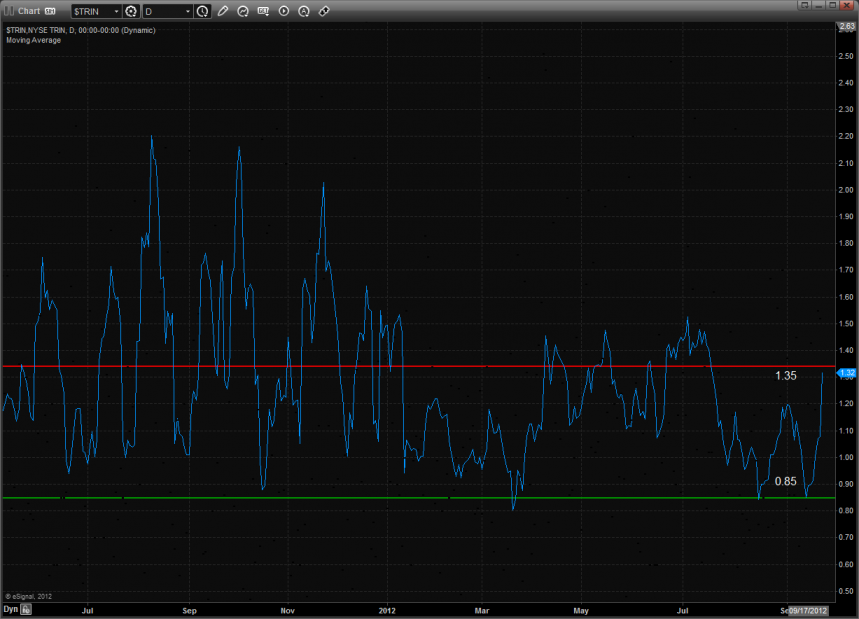
The intraday Trin closed at a very high level and almost has the 10-day average in the oversold range.
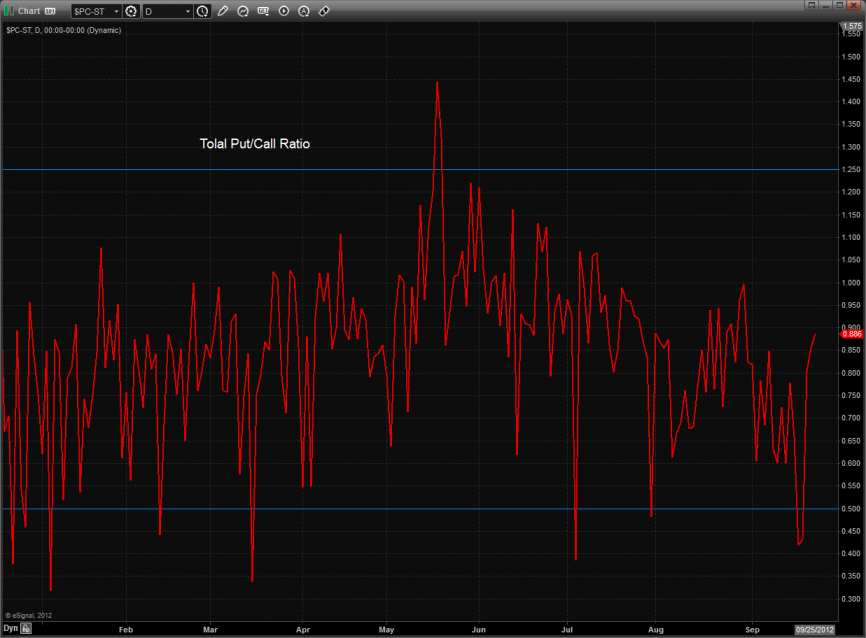
Total put/call ratio:
Multi sector daily chart:
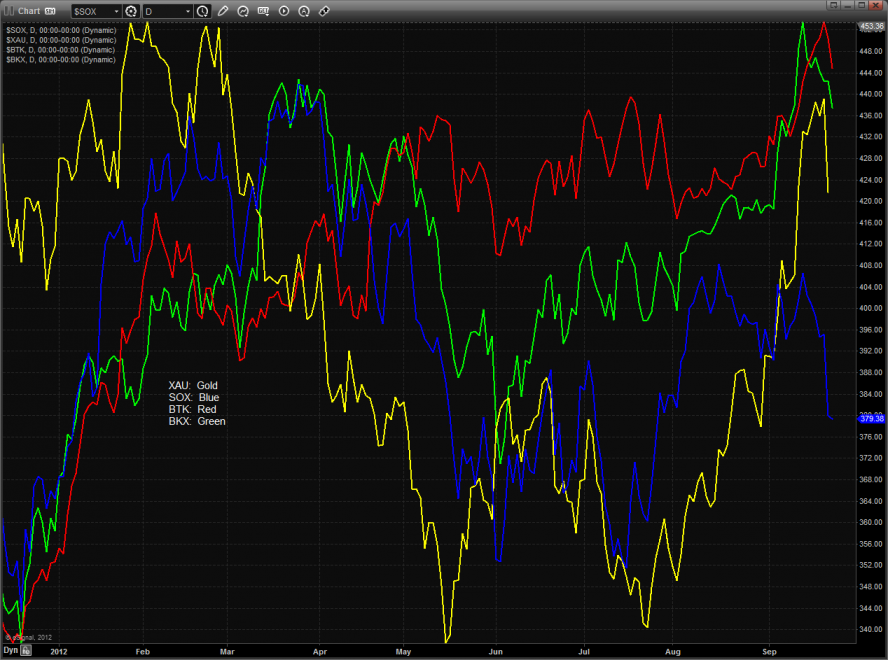
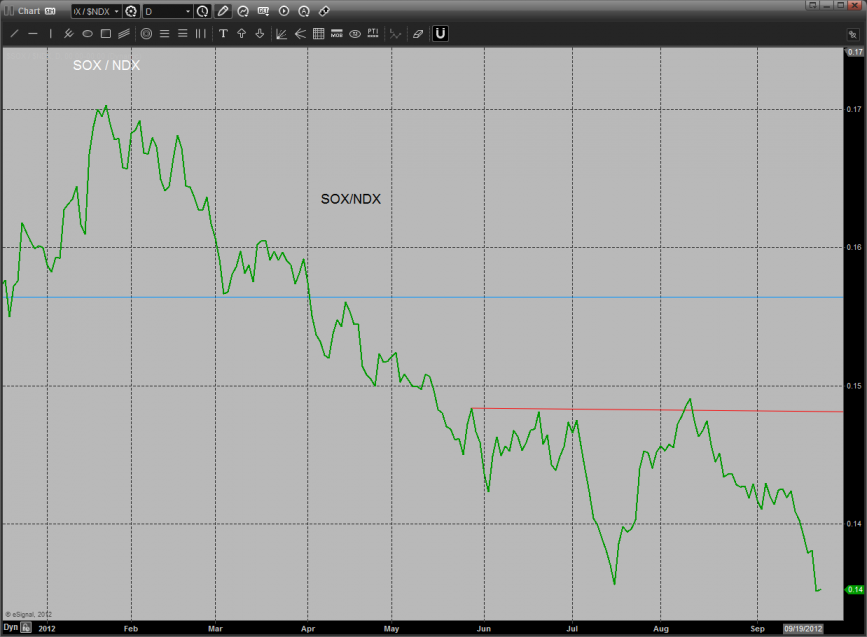
The SOX/NDX cross made a new marginal low on the move. A follow through to the downside would be very bearish for the overall NDX.
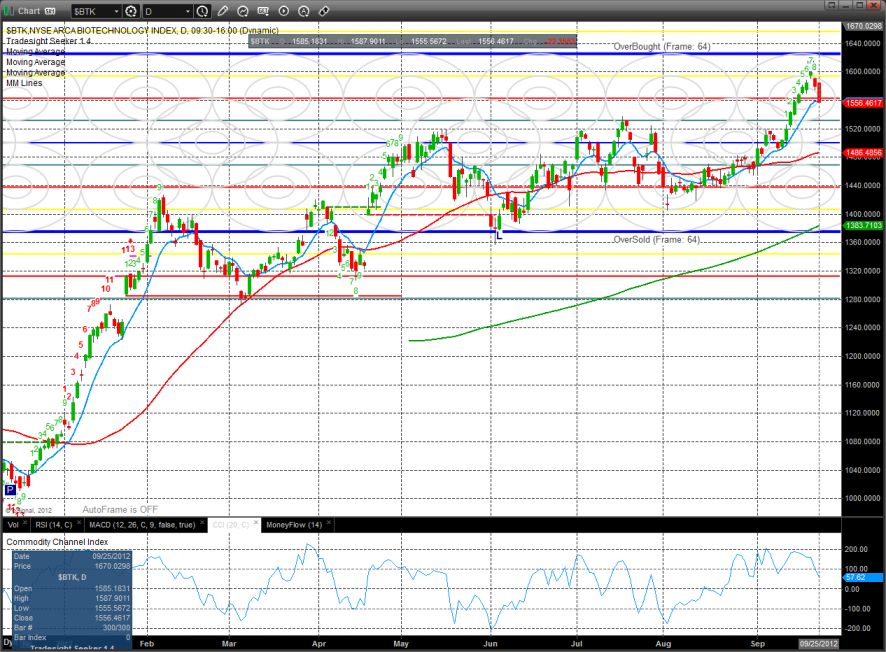
All of the major averages were lower on the day with the BTK being the best of the worst. There is key support just below at the previous breakout level.
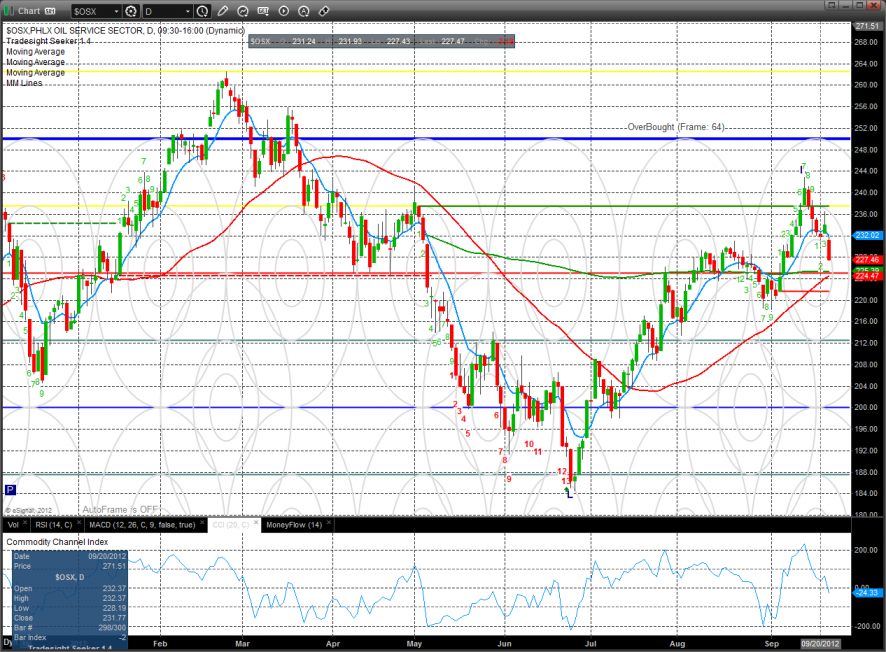
The OSX traded in line with the broad market and is dangerously close to breaking below the 50 and 200dma’s. If they are taken out, look out below.
The BKX settled below the 8/8 level and more importantly below the Q1 highs showing relative weakness on the day. There is a lot of space between settlement and the next support area defined by the static trend line.
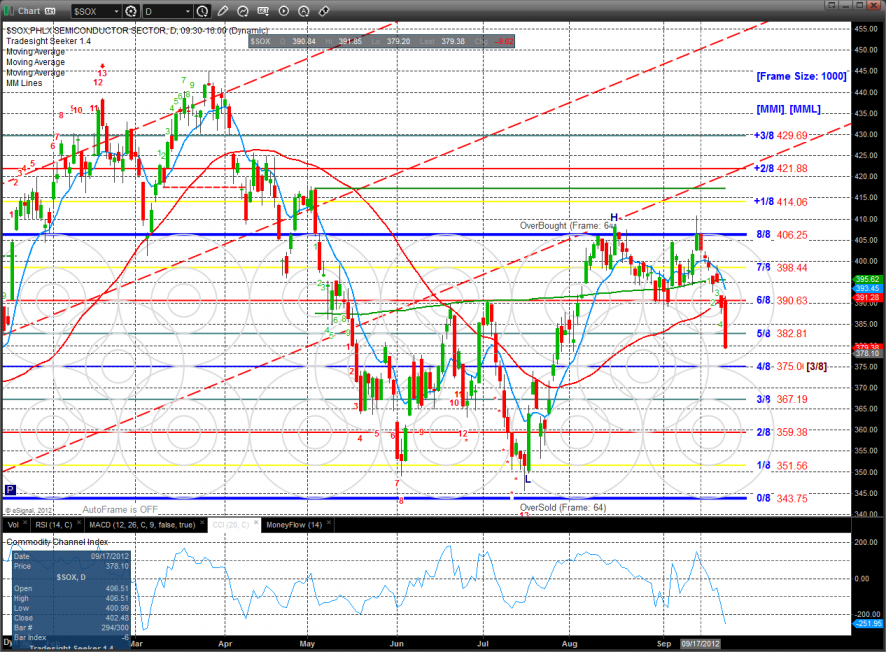
The important SOX index had a horrible day losing 2.5% and settling decisively below all the major moving averages. This is real problem for the NDX and by association the SPX. The chart is short term oversold but should find resistance on bounces to the 6/8 level
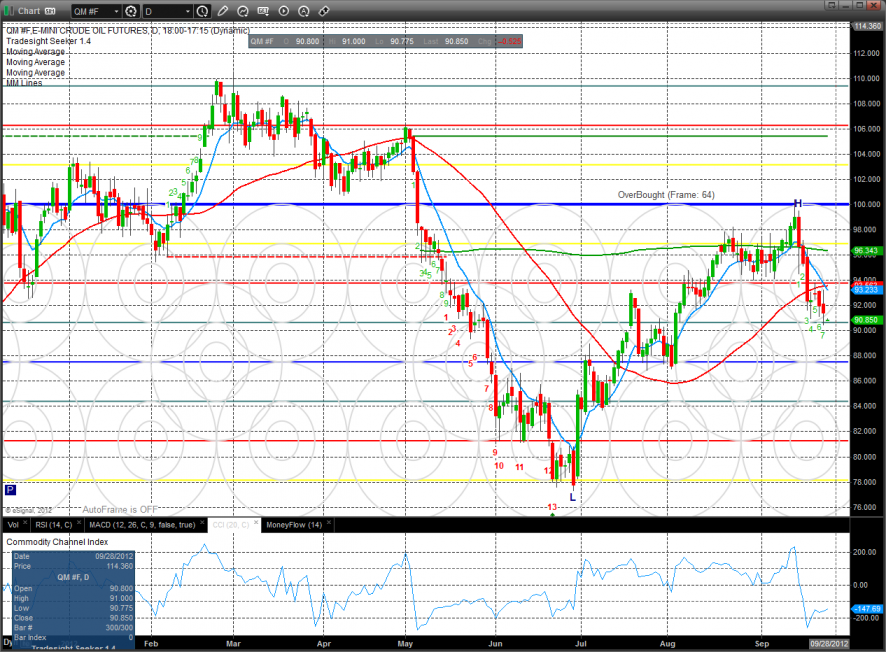
Oil:
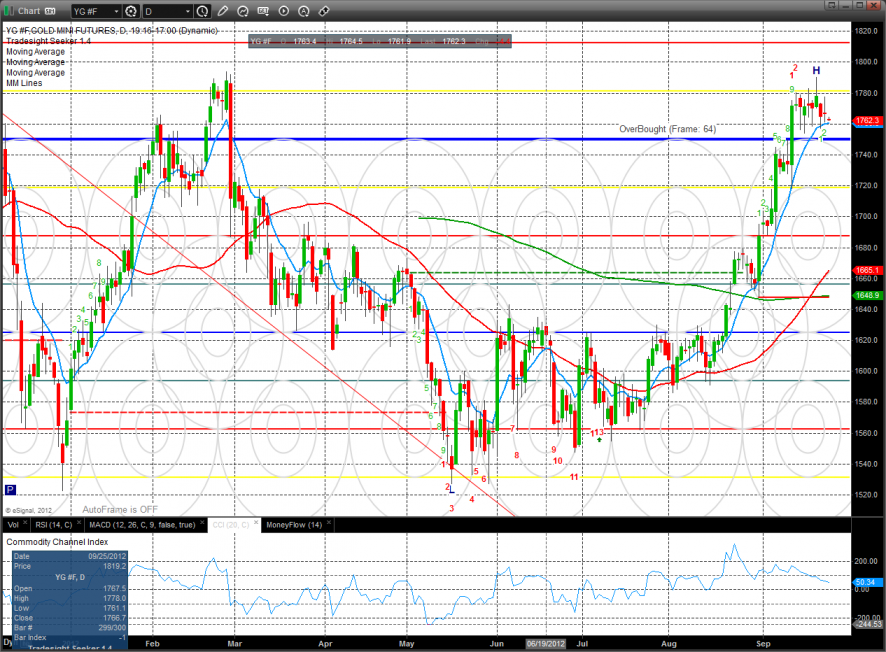
Gold:
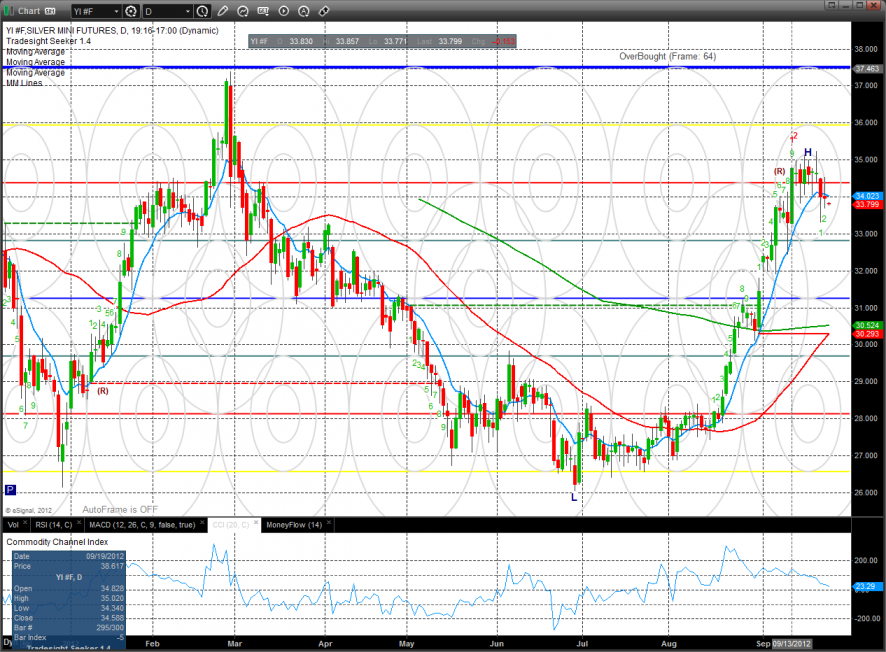
Silver:
Tradesight Market Preview for 9/26/12
September 25, 2012
|In Tradesight