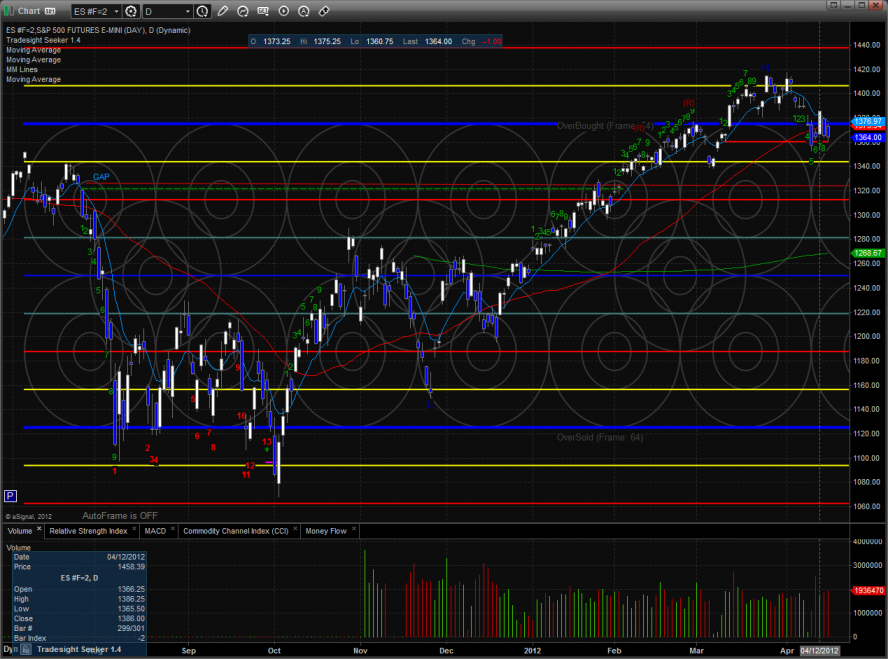
The ES was lower by one handle on the day one handle closing at key support just above the static trend line. The pattern is now 9 days down and setup for a bounce. This doesn’t mean that the bounce will happen Tuesday but probability favors that there will be a “B” wave bounce somewhere.
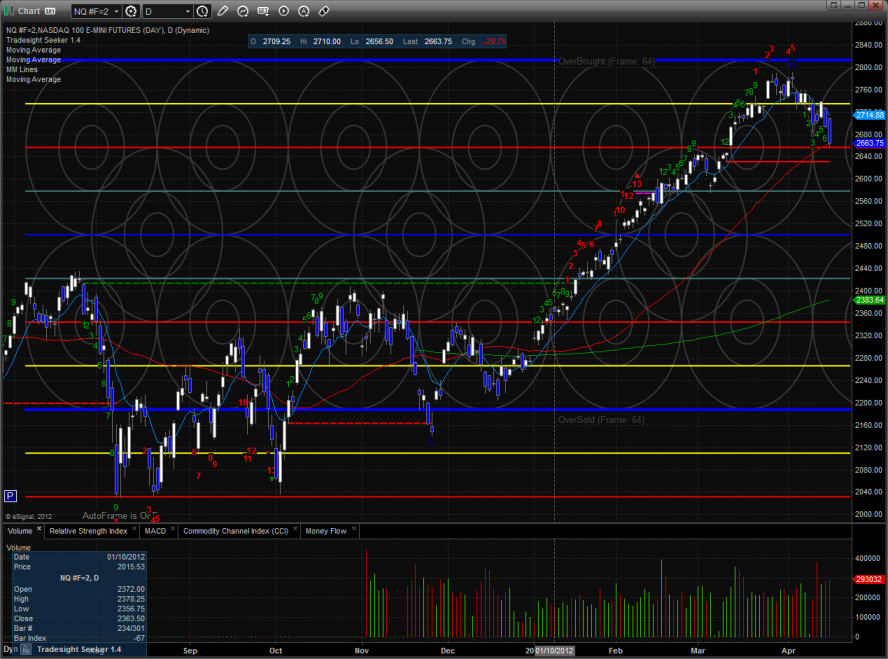
The NQ futures were much weaker than the SP losing 30 on the day. The pattern is much different than the SP because the static trend line has yet to come into play and price is not below the 50dma. The Seeker setup count is only 7 days down.
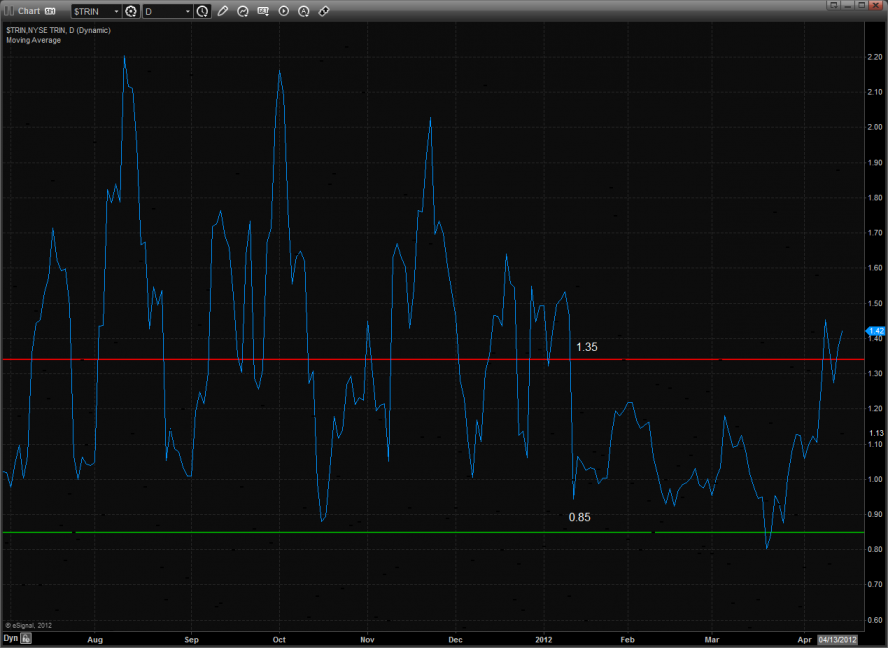
The 10-day Trin is in oversold territory:
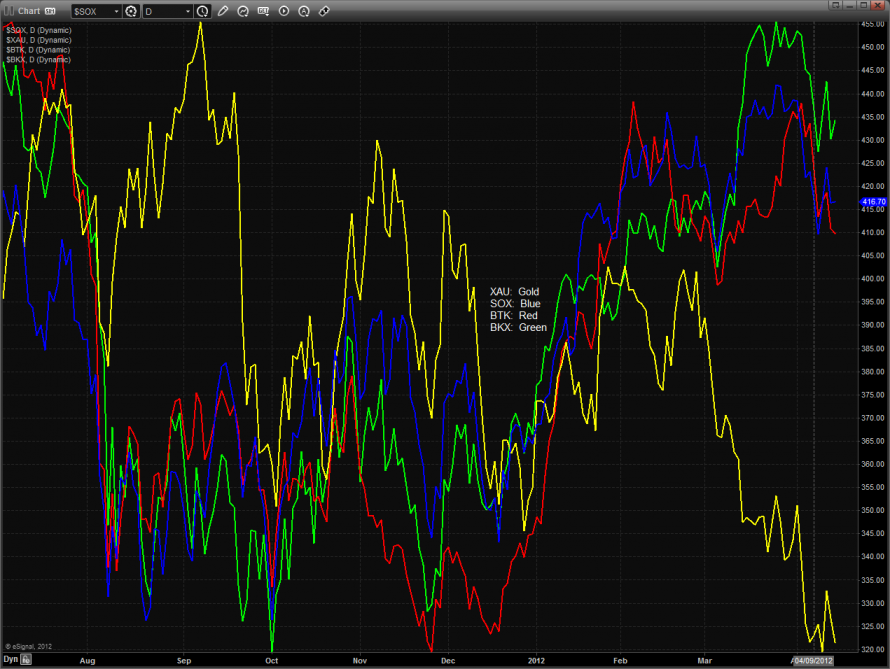
Multi sector daily chart:
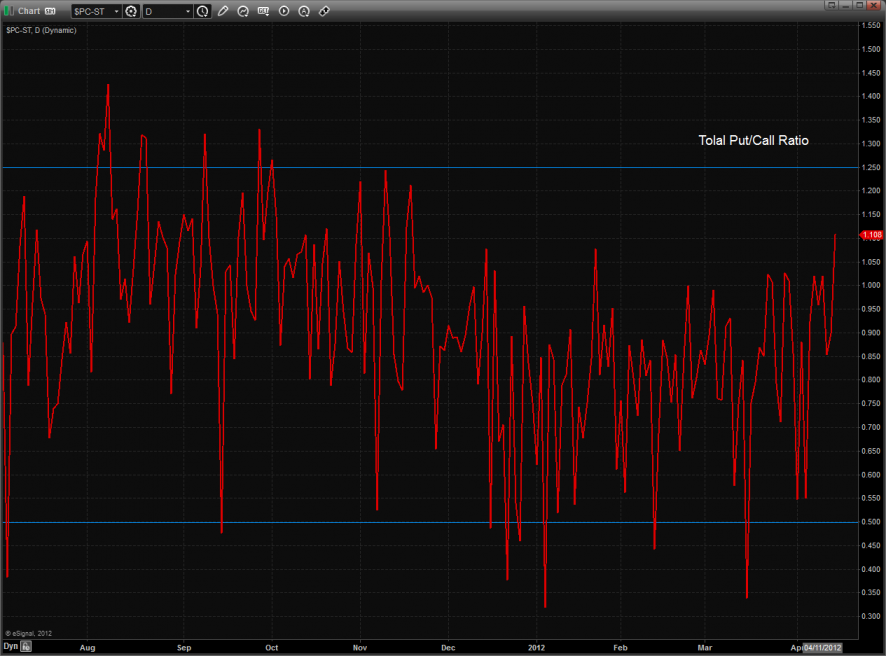
The total put/call ratio has recorded the highest close of the year which means that investors has been accumulating downside protection. This is a contra-indicator.
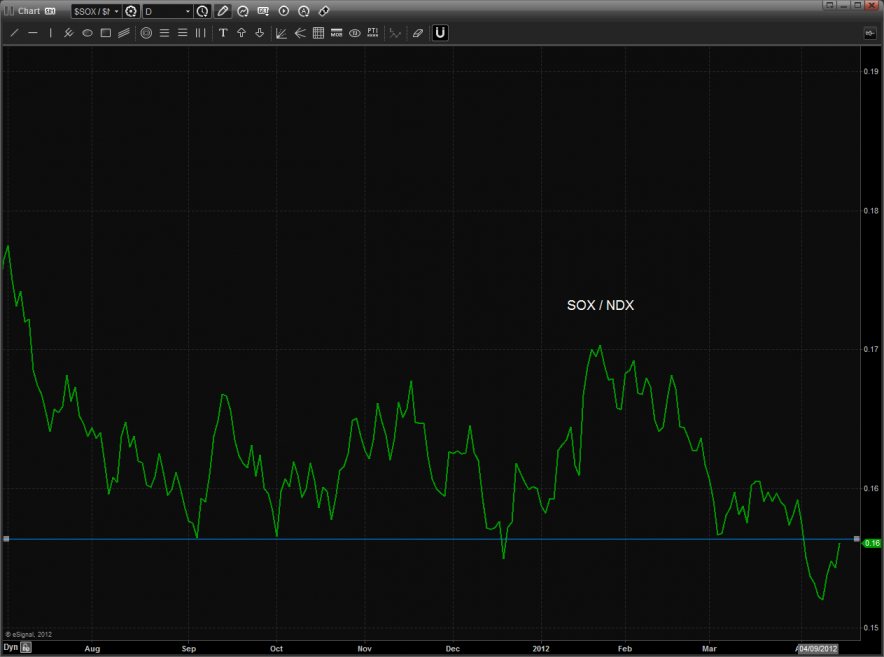
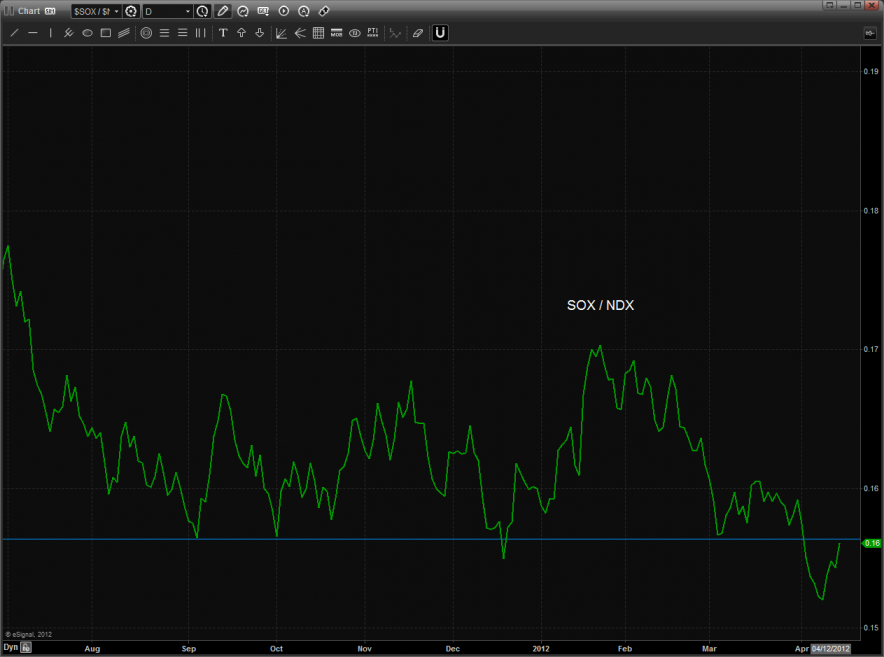
The SOX/NDX cross has bounced back to the breakdown level which is a sign of relative strength for the SOX. This is potentially bullish if the bounce doesn’t fail at the breakdown.
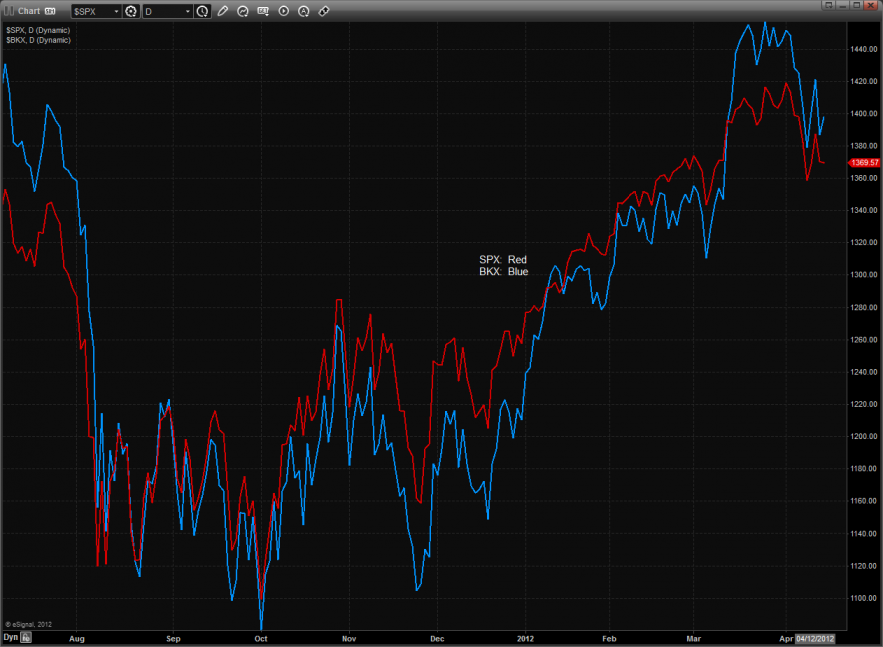
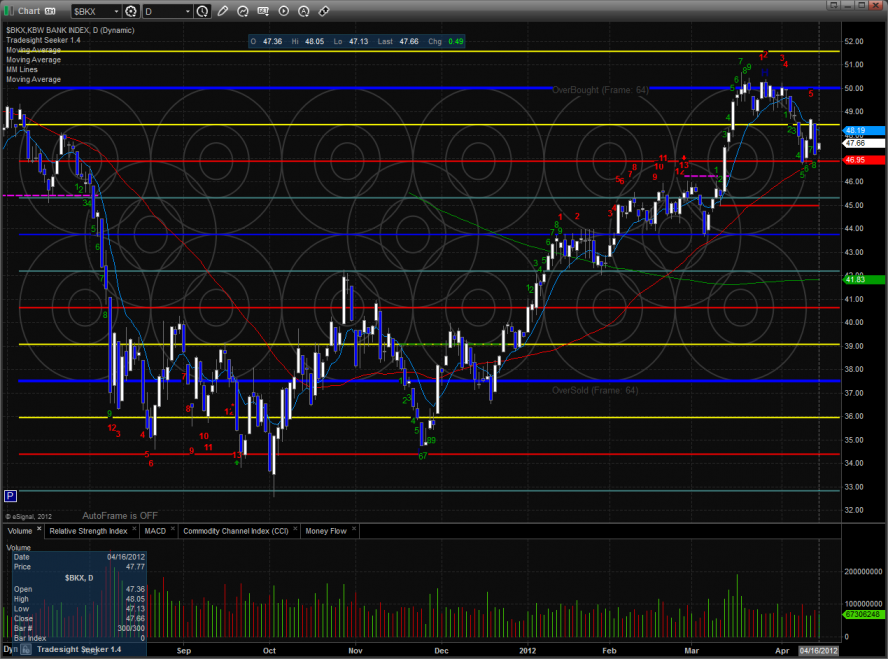
The BKX was relatively strong vs. the NDX which is bullish for the broad market.
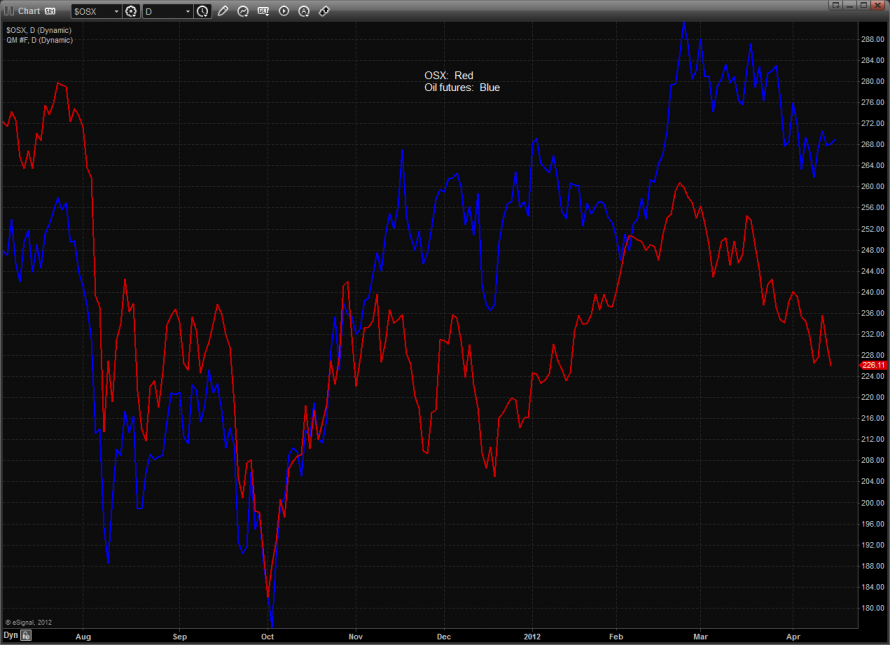
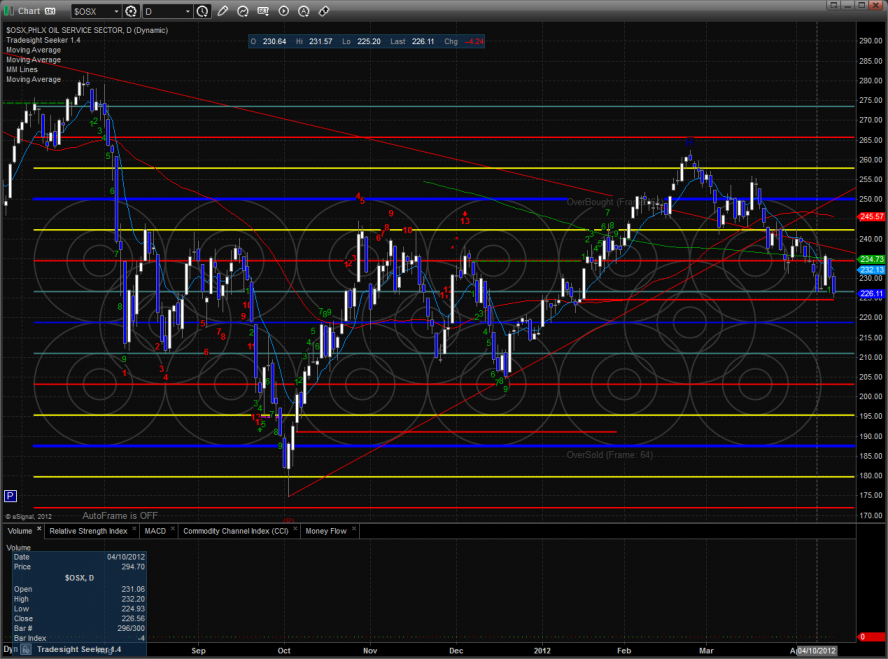
The OSX vs. crude futures made a new low on the move. This is one intermarket pair that throws cold water on the broad market bounce setup.
The BKX was the top gun on the day and is now 9 days down. Note that today’s candle was inside yesterday’s candle.
The SOX was unchanged on the day and was inside yesterday’s range.
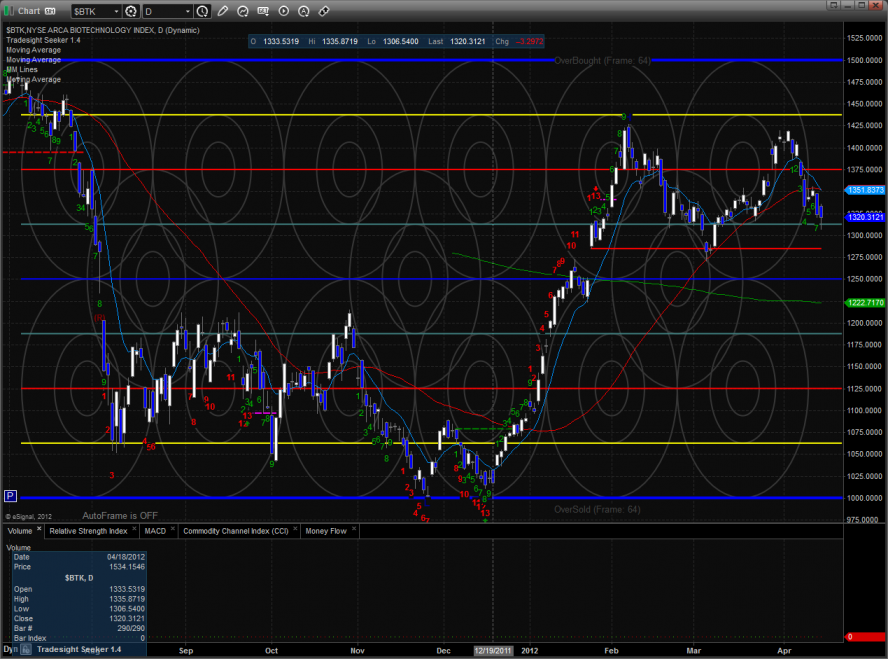
The BTK is 8 days down.
The OSX was the last laggard on the day,
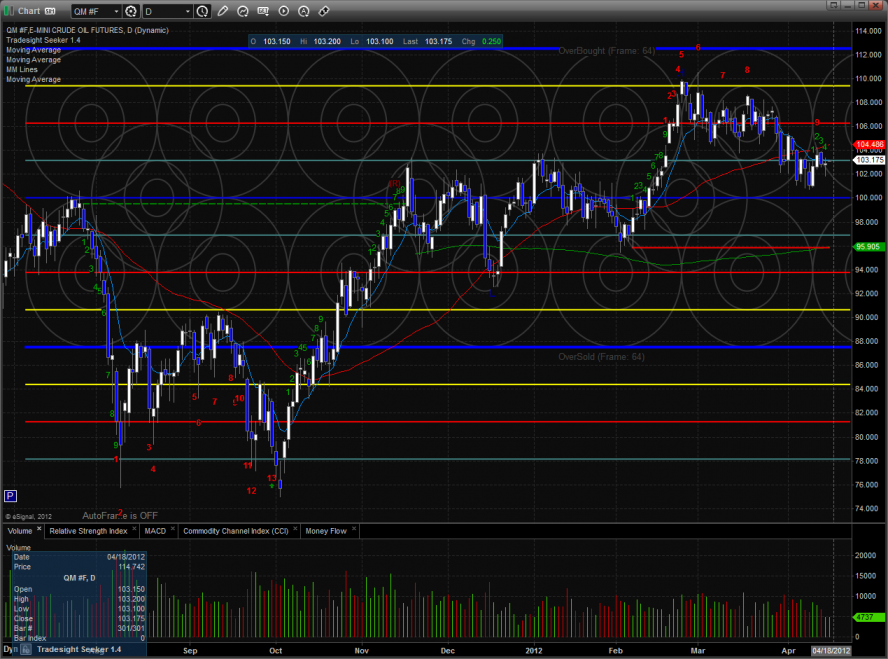
Oil:
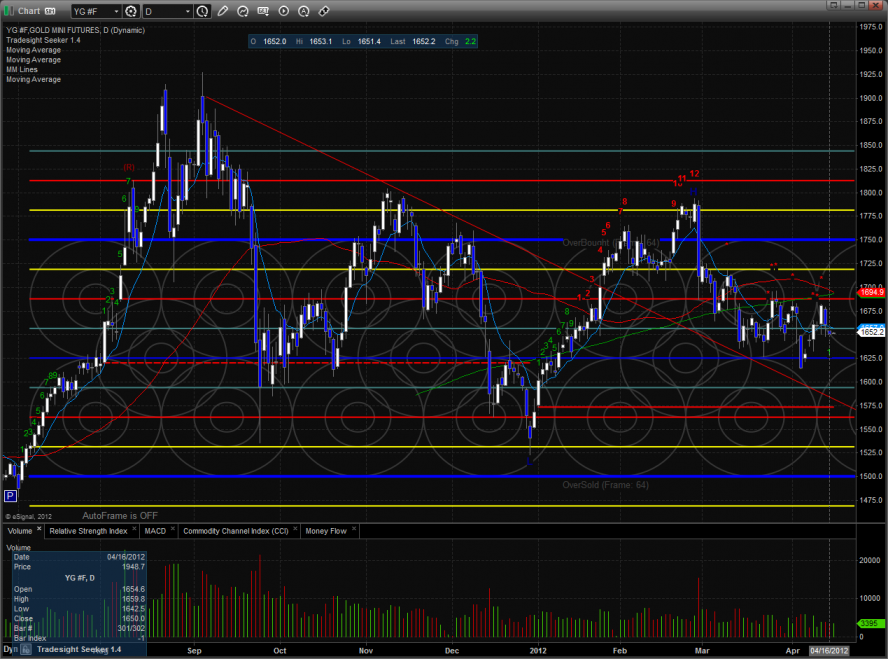
Gold:
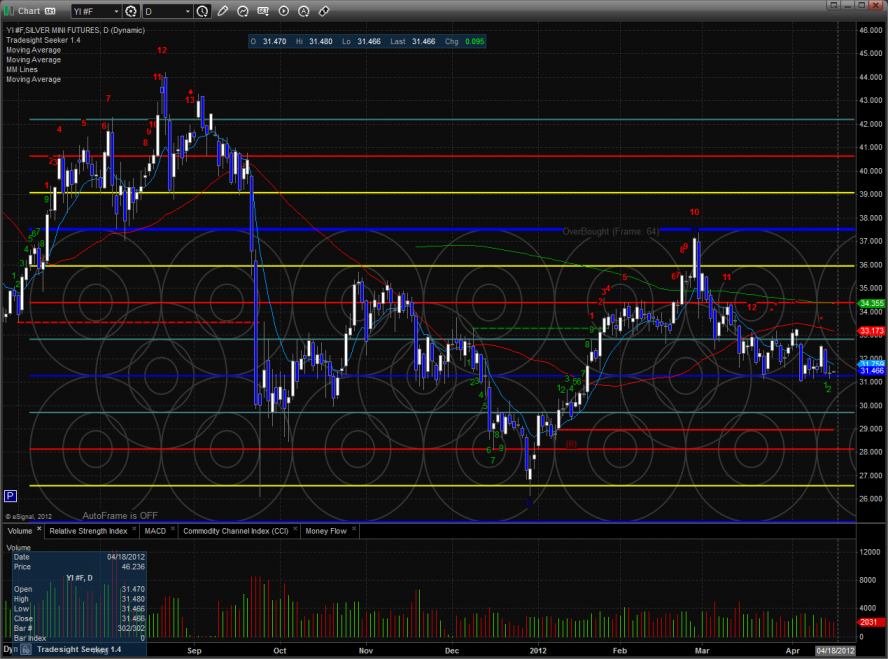
Silver:
Tradesight Market Preview for 4/17/12
April 16, 2012
|In Tradesight