To mark the two year anniversary of the stock market recovery it might be a good time to examine the longer term charts.
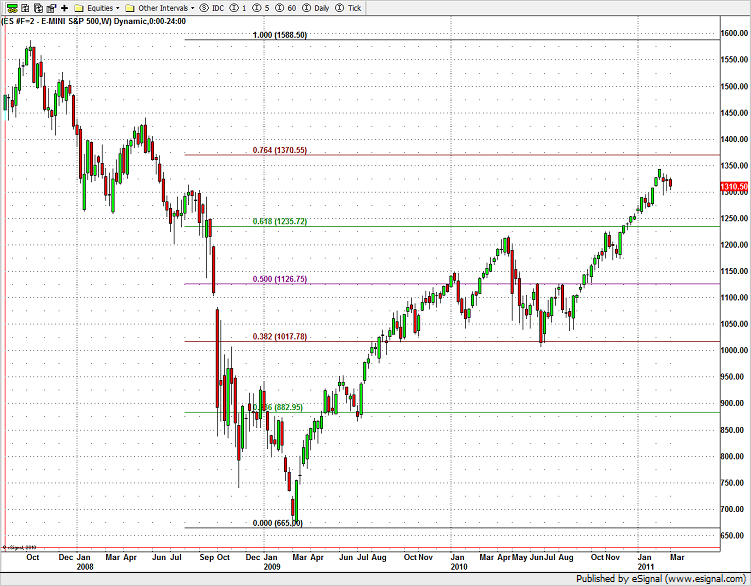
In the weekly chart below, price has recovered to between the 62 and 76% fibs.
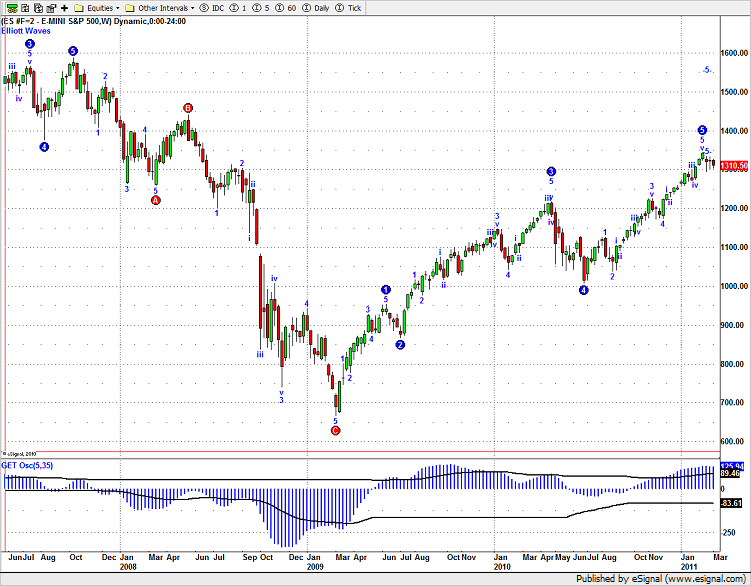
Adding a wave count to the weekly ES chart shows that price has qualified for a complete move. Upward impulse 1 and 3 have completed and wave 5 will complete when a full corrective wave meets the minimum requirements.
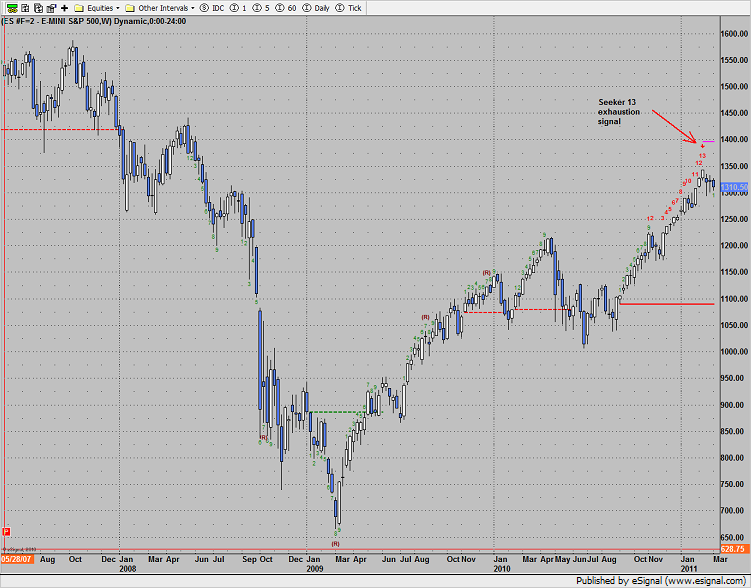
In the weekly ES chart, the Seeker has just recently completed the exhaustion countdown. Note that this is the first completed 13 countdown of the entire move which highlights the maturity of the move.
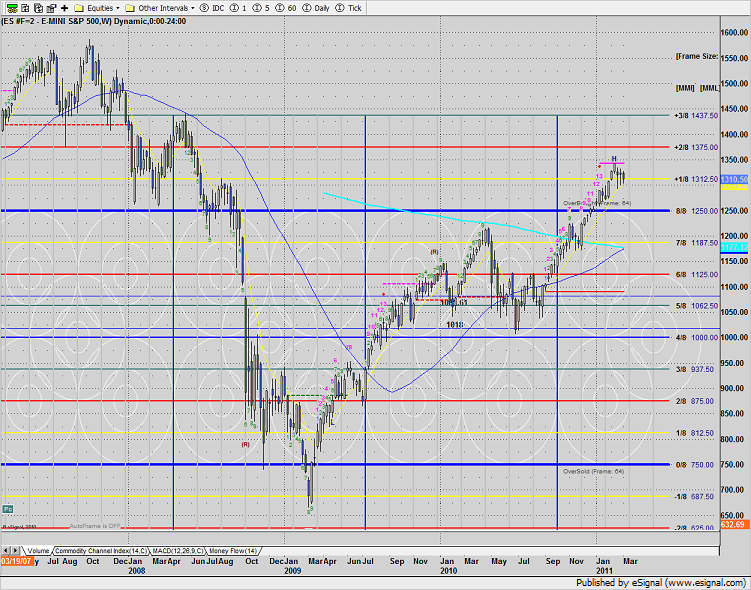
The weekly chart with the addition of a Gann box has exceeded the 8/8 level and hit the +1/8 overbought threshold. If the +2/8 level is exceeded on a closing basis, the box will reset and put the old highs in play.
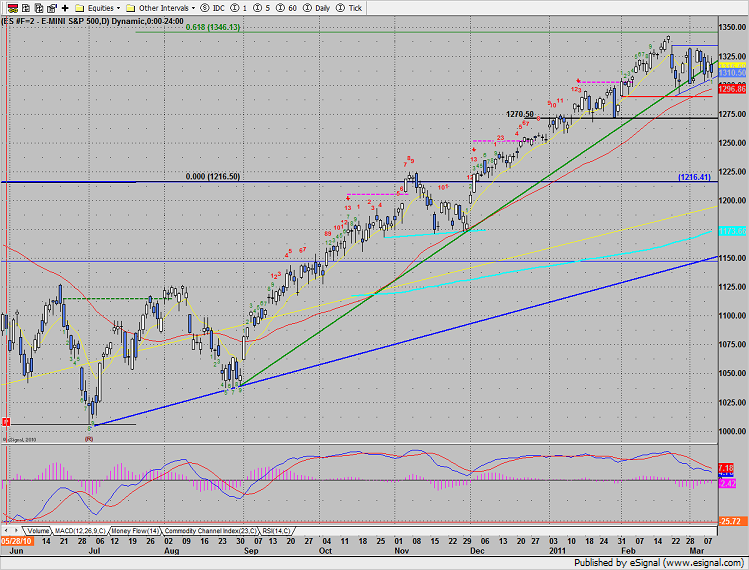
Wednesday, the ES lost 4 on the day but was contained within the prior days range. This is now a triple inside pattern and loaded with energy. The breakout (close outside of the range) should be decisive and a very important candle on the chart. Keep in mind that he short term pattern remains a rising wedge.
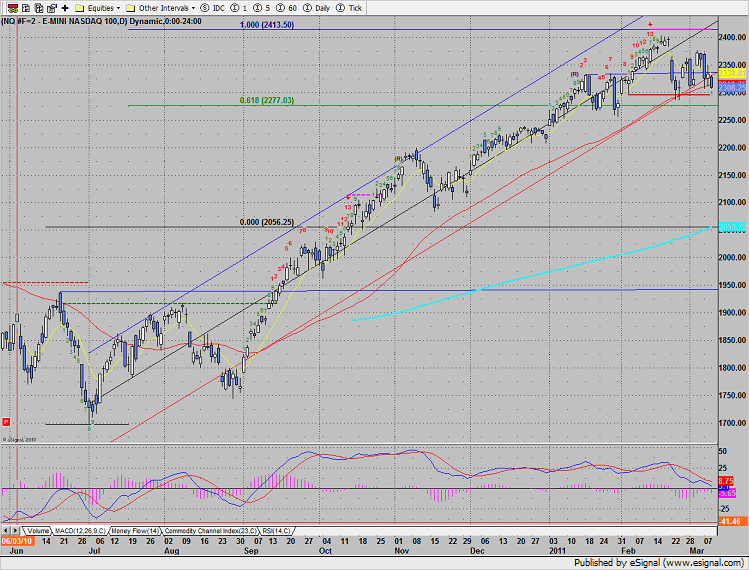
Naz was lower by 23 settling below the 50dma for the first time since Last August. So far the bulls have kept the MACD from breaking below the zero line. Holding or losing this level is very important.
Multi sector daily chart:
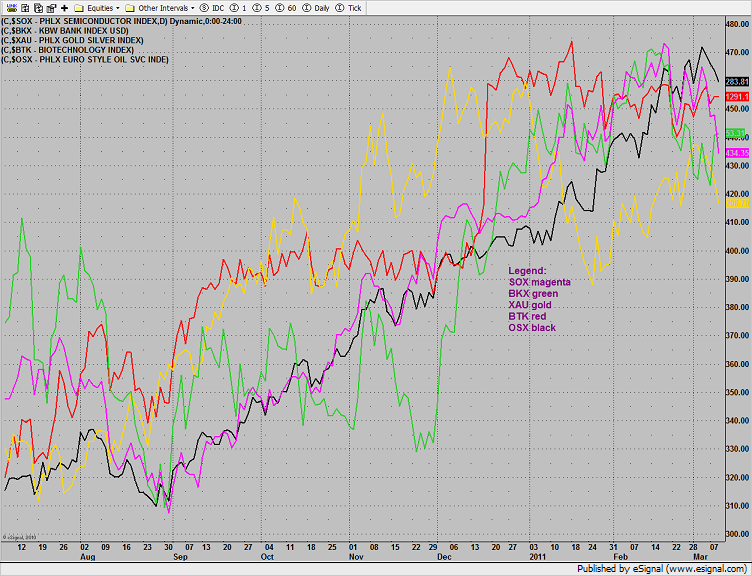
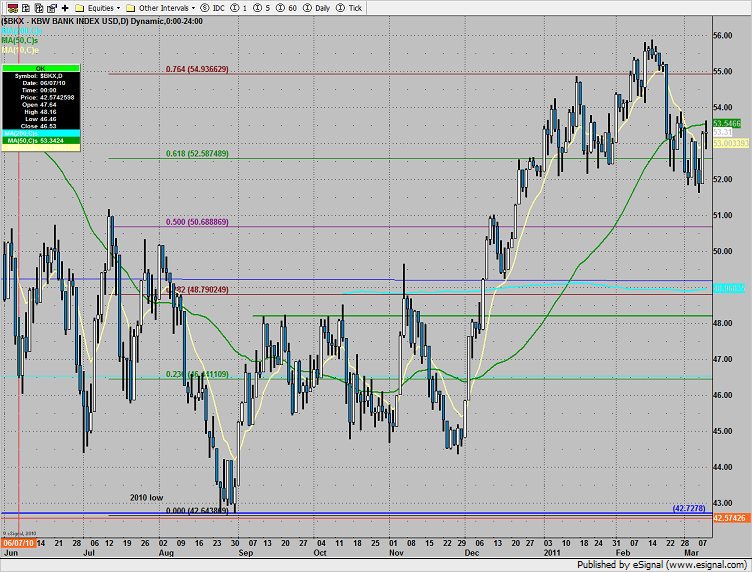
The BKX was the best performing major sector, save the defensive consumer durables, on the day.
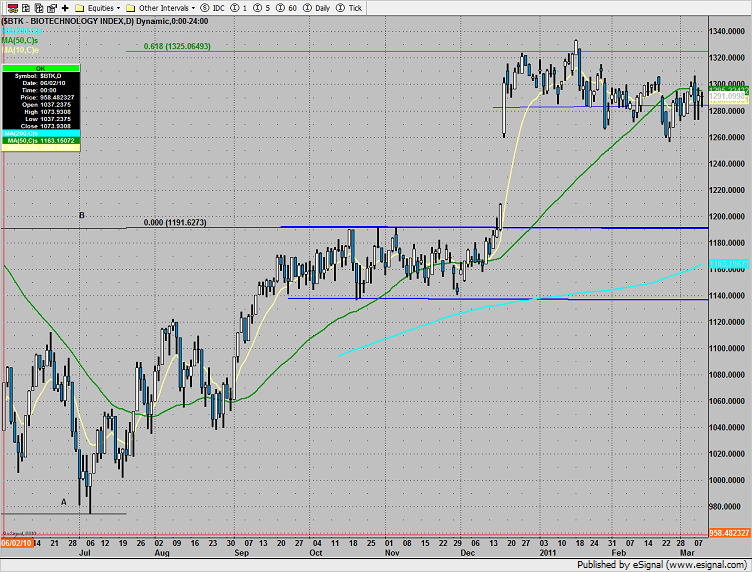
The BTK posted an indecisive day:
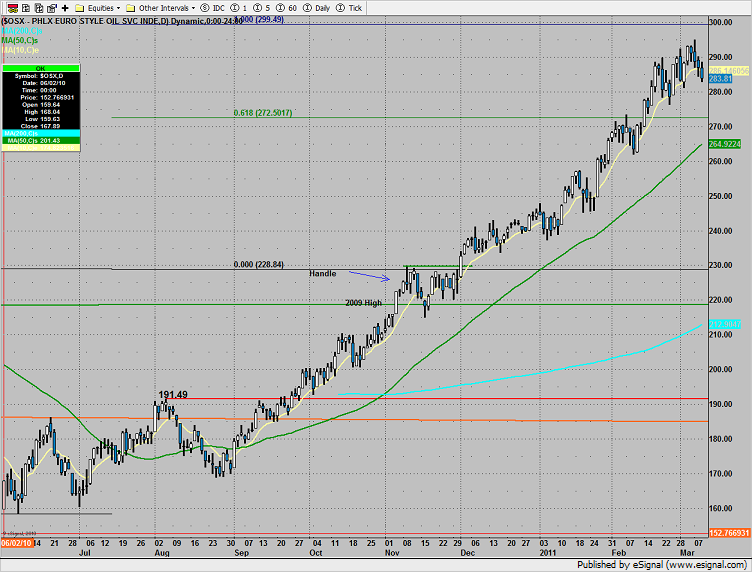
The OIH lost the 10ema and this leading index will put pressure on the broad market if the momentum turns down.
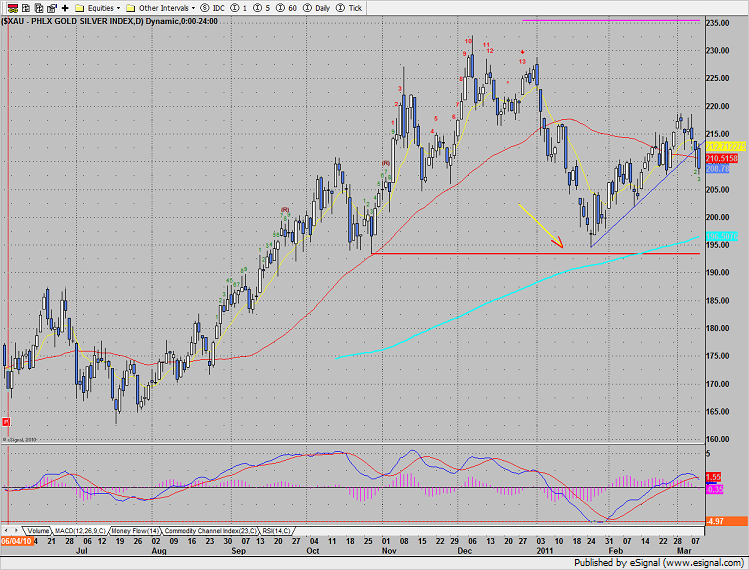
The XAU was a source of funds, decisively breaking under the near term DTL. Keep an eye on this sector for short candidates.
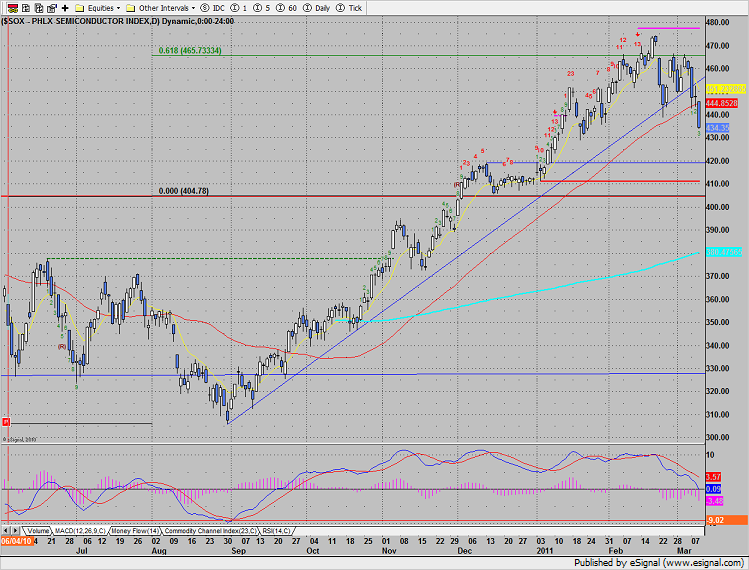
The SOX index is making good on the Seeker 13 exhaustion signal and is very close to breaking the zero line of the MACD. If this important index continues lower there are very negative implications for the Naz.
Tradesight Market Preview for 3/10/11
March 9, 2011
|In Tradesight