The best trading months of the year are typically from mid-October through mid-April. We’ve just entered that period with a lot going on in the world, much more than usual economically.
Let’s take a broad look at where we are at in the overall markets. We’ll start with a shorter-term look at some of the key indices.
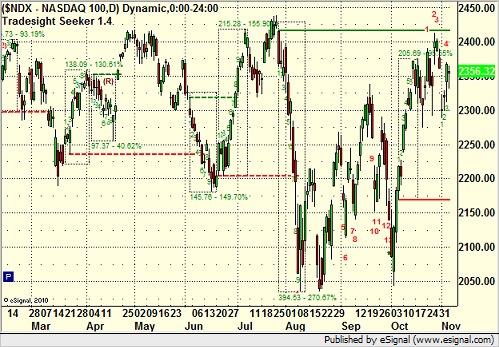
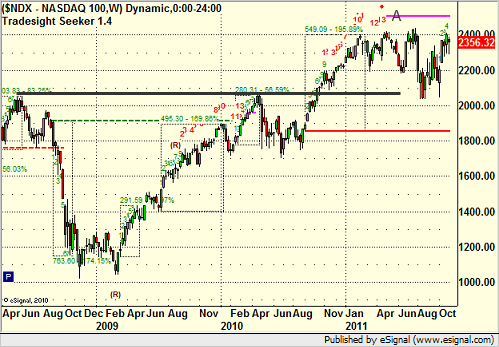
The NASDAQ 100 (NDX) is barely off the highs of the year at this point, which is extremely impressive given the minor meltdown that we had just over a month ago, plus everything still going on in Europe:
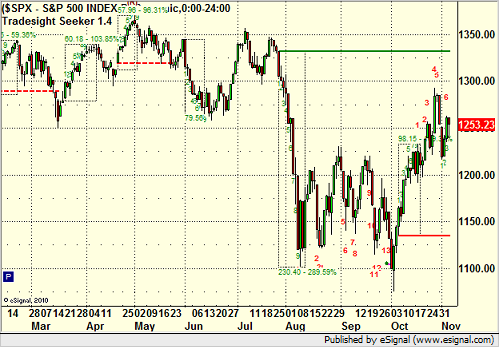
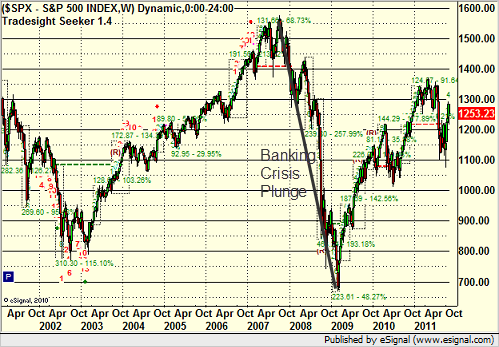
The broad market S&P 500 (SPX) is a little lower in the year’s range, about at the mid-point, but has also rallied nicely off of lows:
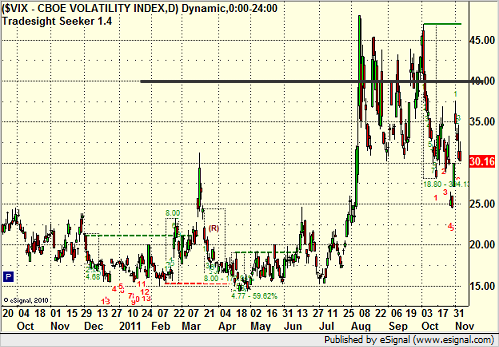
We follow the VIX primarily to show us where “panic” bottoms occur. A number over 40 rarely lasts for more than a couple of days and often leads to a reversal in the markets to the update. The lone exception to this was the banking crash in 2008, where the VIX reached 80 and held over 40 for weeks. But, if you look at the VIX recently and compare to the S&P and NDX above, you can see that 40 was the key number and that once we really broke back under 40 for good at the beginning of October, that was the bottom in the markets:
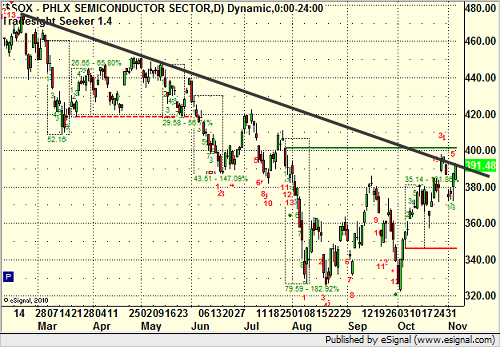
Now, let’s have a look at some of the key sectors. Despite the fact that the NDX is near highs, the SOX (Semiconductors) are still in a downtrend:
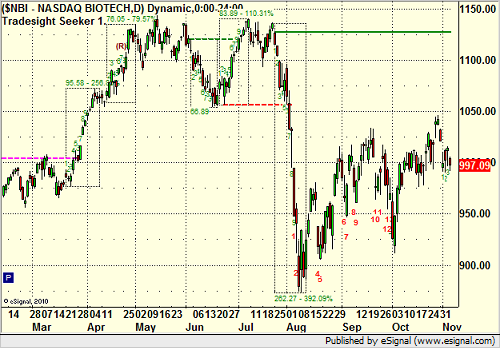
The biotechs are fairly dull and mid-range, which, typically, they lead runs in the market:
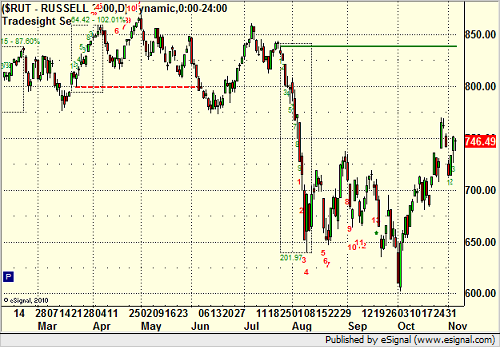
The Small Cap sector, as measured by the Russell 2000, took a bigger beating two months back than the rest of the market, but just like everything else, it is showing signs of recovery so far. Also, the Small Caps in particular tend to do well in the October-April timeframe:
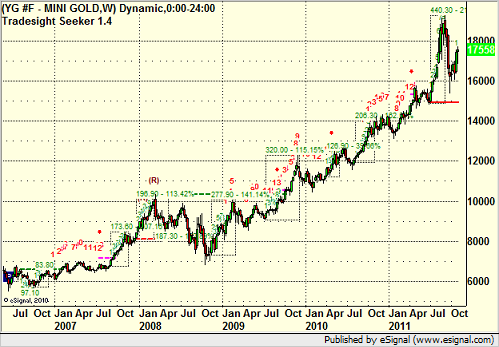
Here’s a quick look at Gold, still in an uptrend:
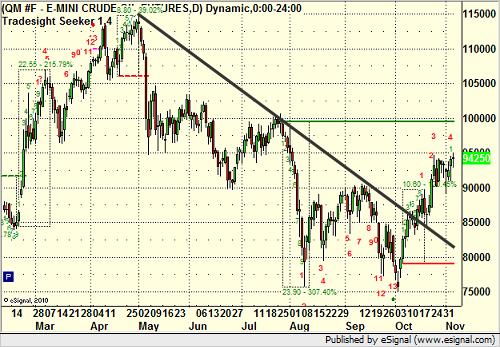
And oil, which recently broke a downtrend, but also gave us a 13 count buy signal on our Seeker tool at the lows that is currently in play (note that the green line is the operating static trendline of the move down, so that may be a target):
For reference sake, here’s the weekly S&P showing 10 years of data…and we’re exactly where we started. That’s the definition of a “lost decade” if you ask me, right here in this picture:
The weekly NDX going back just two years shows a nice cup and handle breakout through the black line, but then we had a 13-bar Seeker sell signal back in April that is still essentially the high:
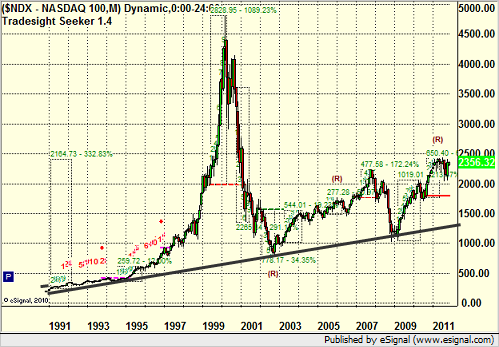
And if we back things out even further, here is 15 years of NDX monthly data. What’s amazing is that the uptrend line is so precise (and in place):
We should also take a look at the last few years on the US Dollar Index, which is now in an uptrend on a longer term (longer line) and shorter term (short line) time frame, after breaking the intermediate term downtrend line recently:
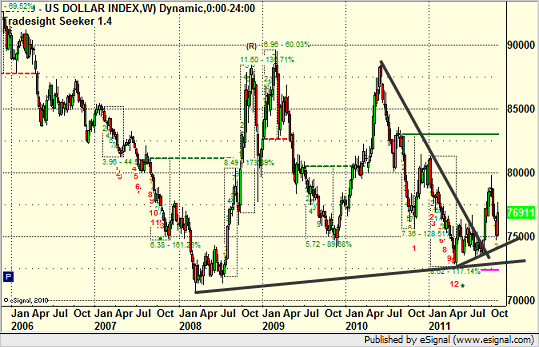
The low on the US Dollar was back in 2008, which came after about 8 years of steady weakening. But, things tend to swing back over time, and while the EURUSD was a mess in the late 1990’s and came roaring back over the last 10 years, the situation in Europe is the primary factor in all of the uncertainty out there right now. Here’s four years of weekly data on the EURUSD:
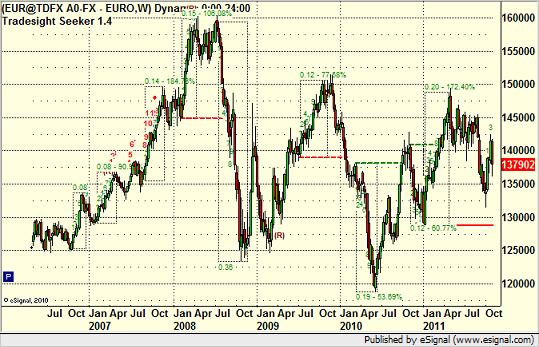
That may be the chart to watch as we see if Europe can collectively get their house in order, or whether the currency itself might dissolve, which is something that would certainly be a negative for short term economic growth here in the US, but would probably be a positive for the US Dollar.
Remember, a weak is great when you are a manufacturing economy. It makes it easier for others to buy your products. We are not a manufacturing economy. For a service based economy, you want a stronger currency, which is something that I have been saying for ten years now in these reports. It may very well be the case that what hurts Europe the most is the most beneficial option for us in the long run.
We will continue to monitor the markets daily, but one thing is certain. Our trading opportunities have been extremely good for the last couple of months, and we’ve had at least 3 days per week of solid triggers and gains, which is all you can ask for as a trader. Volume and movement, please.
Current View of the Markets on 11/5/11
November 6, 2011
|In Tradesight