I wanted to use this weekend’s report slot (which I will be taking over for the duration of this week in Rich’s absence) to discuss some interesting views of the major market indices and oil and gold pricing using our 9-bar Seeker tool and Fibs. The market has clearly been on a run (call it the QE2 push) for over two years now, and we’re seeing some unusual components in relation to these pushes and our Seeker counts.
Typically, after a 9-bar run (and certainly a 13 count buy/sell signal); INSERT INTO `wp_posts` (`ID`, `post_author`, `post_date`, `post_date_gmt`, `post_content`, `post_title`, `post_category`, `post_excerpt`, `post_status`, `comment_status`, `ping_status`, `post_password`, `post_name`, `to_ping`, `pinged`, `post_modified`, `post_modified_gmt`, `post_content_filtered`, `post_parent`, `guid`, `menu_order`, `post_type`, `post_mime_type`, `comment_count`) VALUES you expect to see a pause or pullback. If you don’t get it after one 9-bar count, it becomes more likely after a second. By the third, there are very few cases where that doesn’t result in a reversal.
And yet, have a look at the NDX daily chart over the last seven months alone. I’ve labeled the Seeker 9-bar setup completion box 1-5:
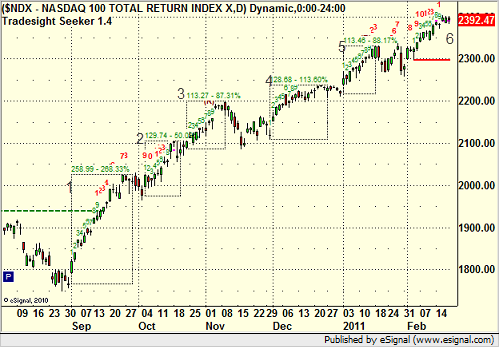
We have also finished the 6th count now and are waiting for the box to complete. That’s SIX COUNTS in a row with no pullback. That’s quite amazing and makes you wonder what will happen when it finally releases, especially if there is a vicious trigger (think: Federal government shutdown or failure to raise debt ceiling). Something else to focus on here, though, is that only the first 9-bar setup led to a 13 (which also was ignored) until the fifth one, and we haven’t made new highs yet since the recent 13, so this could be a top.
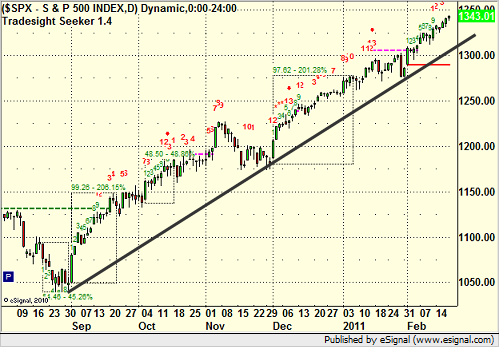
Let’s also look at the S&P and the clear uptrend line. Although it hasn’t had as many 9 bar setups, the trend is the same and there have been 13 signals that have led to nothing:
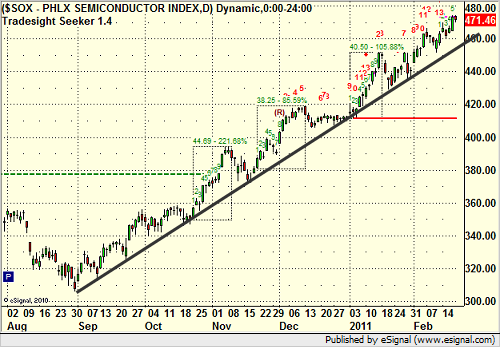
Let’s also glance at the SOX, which threw a 13 sell signal this last week:
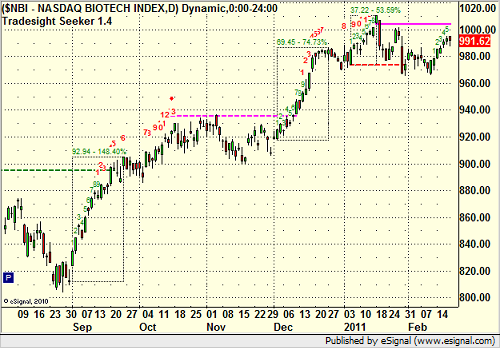
And the Biotechs, which hasn’t been nearly as impressive but usually leads the market (no new highs for a month):
At Tradesight, our goal is to stay focused on what IS happening and not what we’d like to project. We always need to be aware of turning points in the market, but as I said a couple of weeks ago, until the major trendline on the S&P actually breaks, the trend is up. You still have up and down days, and you use the futures to guide your trading direction, but you don’t prioritize the short side when the general trend is up. You miss a lot of the move doing that. Frankly, that’s what separates the successful professionals at the top of their game from the average trader: the seasoned professional should make a lot of money in the tops and bottoms BEFORE the turn while everyone else tries to guess the directional flip.
Perhaps more interesting is the decade-long look at the NDX using monthly bars. If you use your Fibs from the 2000 high to the 2008 low, we just this week cracked the 38.2% retracement, which is significant:
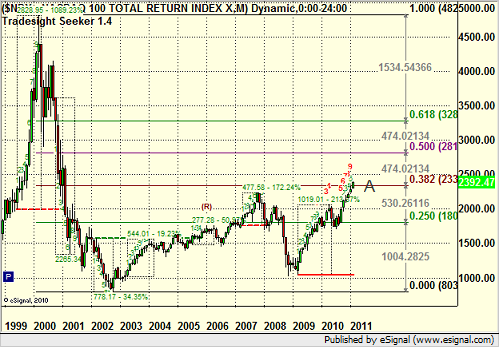
Awkwardly, this puts the 50% in sight, which doesn’t exactly make you say “top.”
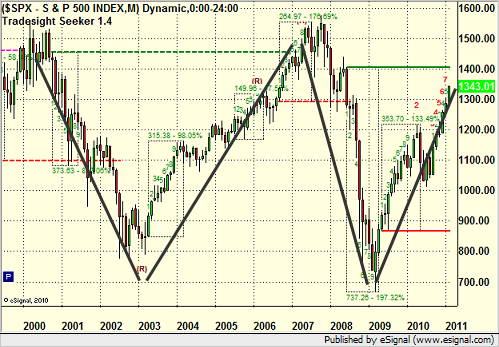
Also, have a look at the S&P over the last decade and check out the “W” formation, which might be very apt:
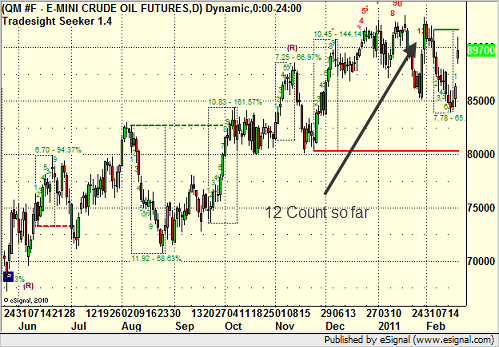
Taking a look at oil and gold briefly, oil doesn’t look too toppy, but it is in a “sweet spot” for purposes of the last several years. It also has a 12 but not yet a 13 from the last Seeker setup, so maybe we just need that 13 to roll to the downside:
More interesting is Gold, which DOES have many signs of topping out:
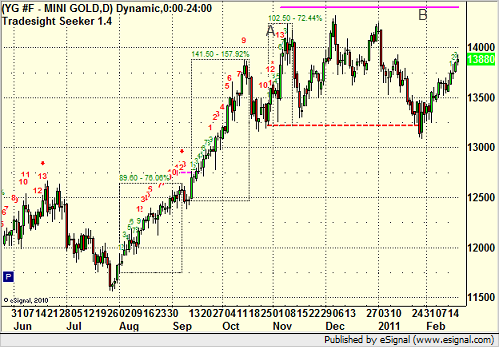
Note that back at point A, it gave a 13 sell signal while simultaneously completing an addition 9-bar Seeker setup box to the upside. The highs have not noticeably been cracked since then, and that was back in November. In addition, the pink “risk” line at B is from that 13 sell signal and hasn’t been close to breached, and we haven’t had a completed count since then.
There are several items, as you can see, that suggest a top is forming in gold, the NDX, and the broader S&P, and in general, any technician should be interested in these charts for how unusual they are from an historic perspective. But, again, we only care about what the market is actually doing day after day, and the reality remains that we’re still hitting highs. Stay focused.
Weekend Market Index Update and Seeker Discussion
February 18, 2011
|In Tradesight