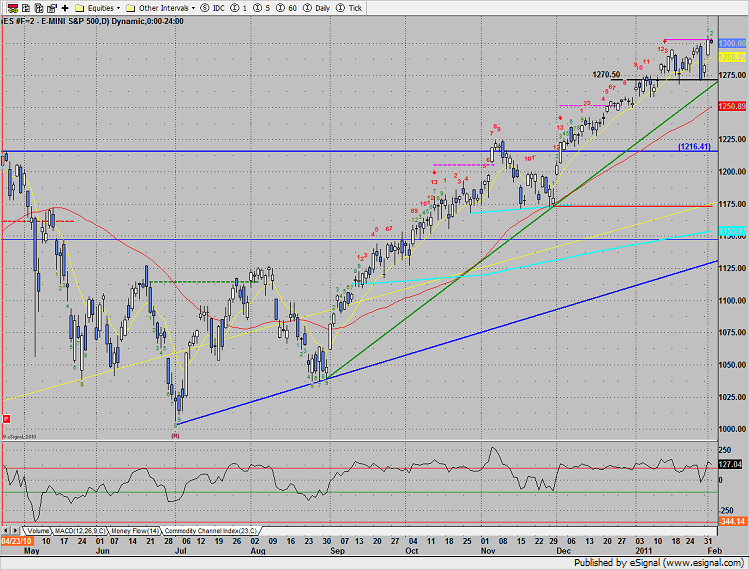
The SP posted a very narrow range inside day, neither impressed nor disappointed by the ADP Employment Report. The Seeker exhaustion signal is still active.
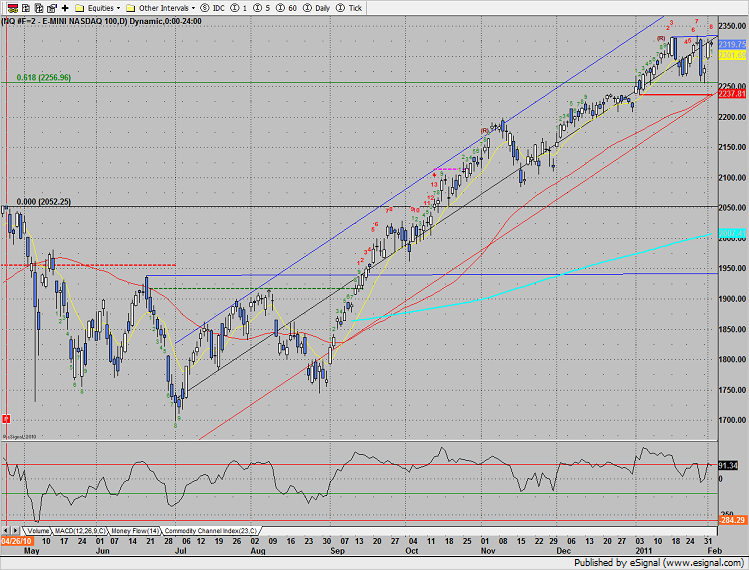
Naz also posted a very narrow range inside day. Price is still contained below the January highs and the Non-farm Payroll number will likely be the deciding factor. Note how the ranges have expanded (read volatility) which can be a sign that a change in trend may be coming. This is a function of the dominant side, the bulls in this case, losing control and transferring control of the tape to the other camp. The upward advance has been very powerful and should be respected, but recognizing this subtle tell can help traders have more confidence and play the new dominant side sooner when a change in trend is detected. The current increase in range from high to low is only about 3%, however if this persists or the range expands, the bulls will be on notice.
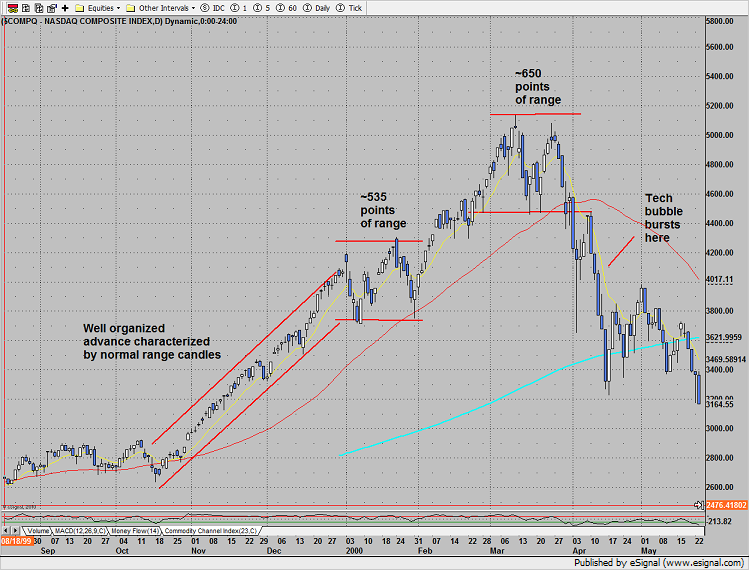
In the chart below is a look at the price action leading up to the top of the NASDAQ tech bubble in 2000/2001. There was a very well organized advance followed by a period wide range trading that covered ~535 points of range in a very sloppy manner. There was a second push higher followed by another range that was even larger than the prior covering ~650 points of range. These disorganized wide ranging moves at the high of an extended impulse are the footprints of the bulls losing control of the tape. Orders of magnitude are always important to monitor. At the end of the great bull market the 535 and 650 point ranges represented moves of about 13%. The current expanded range is only in the order of 3%. Traders who recognize these subtleties will always have the advantage.
Multi sector daily chart:
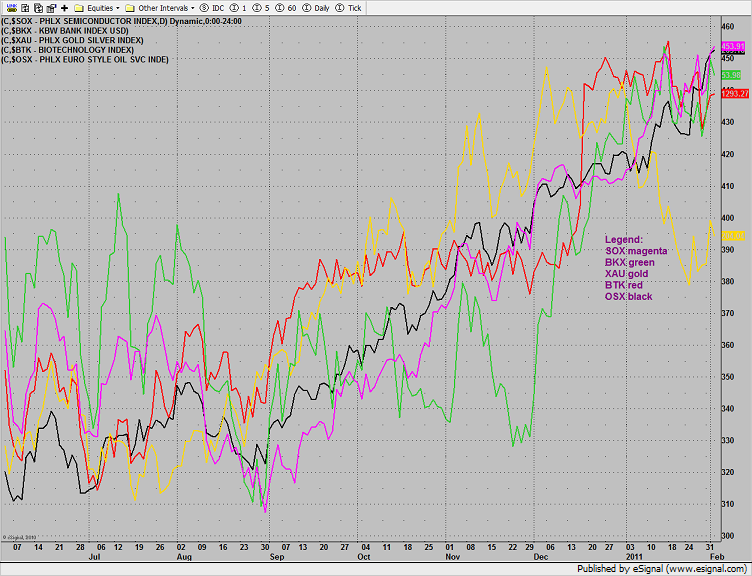
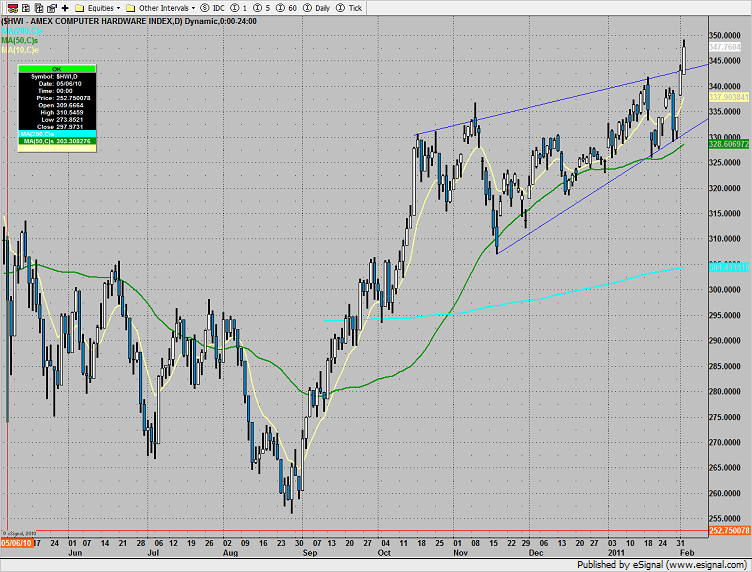
The computer hardware index was top gun, making a backwards breakout of a rising wedge.
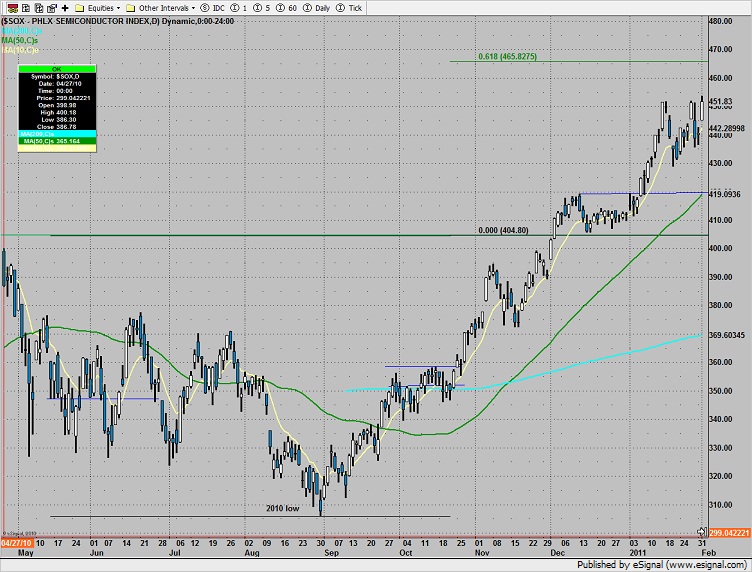
The SOX recorded and closed at a new high on the move.
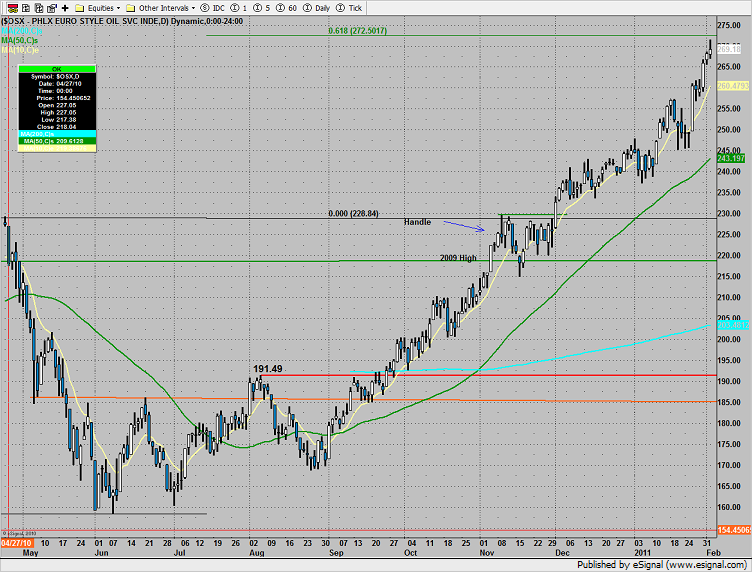
The OSX is getting closer to the measured move target at 272.50.
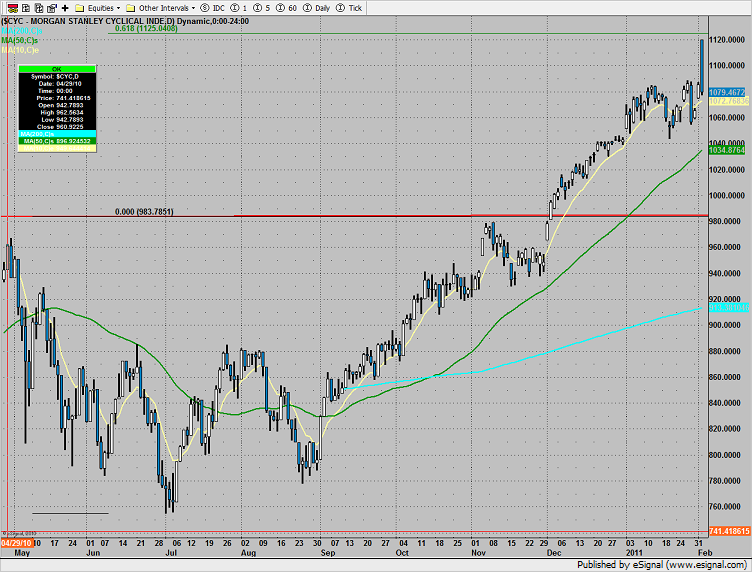
The cyclical index, CYC, posed a strange looking candle at range high. If these prices are correct this is a very bearish development.
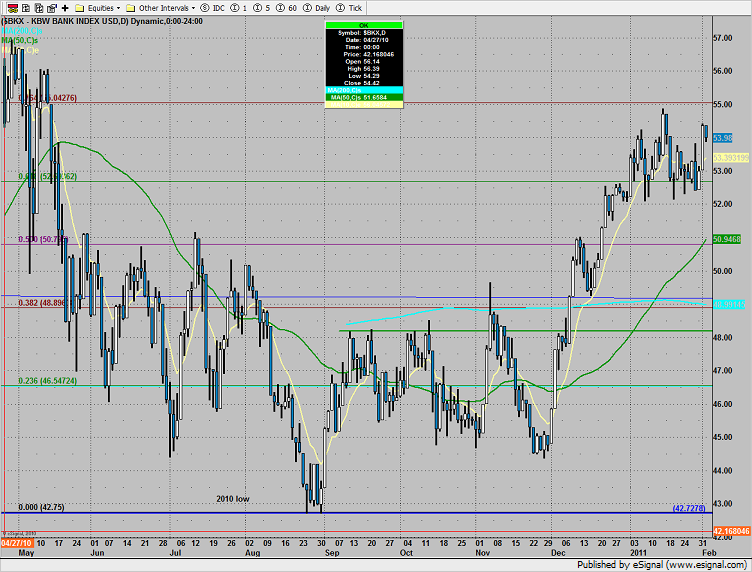
The BKX remains trapped in the same range.
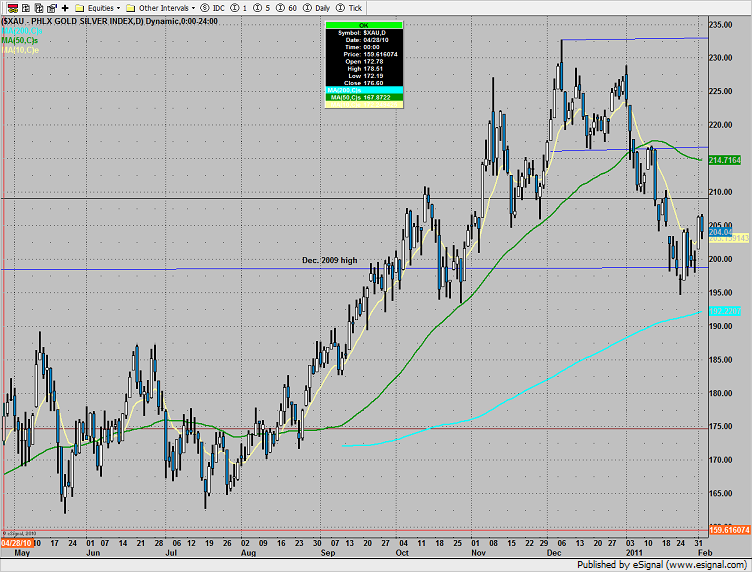
The higher prices seen yesterday in the XAU were stuffed by sellers. This is typical when trying to pivot higher and isn’t necessarily a bounce killer.
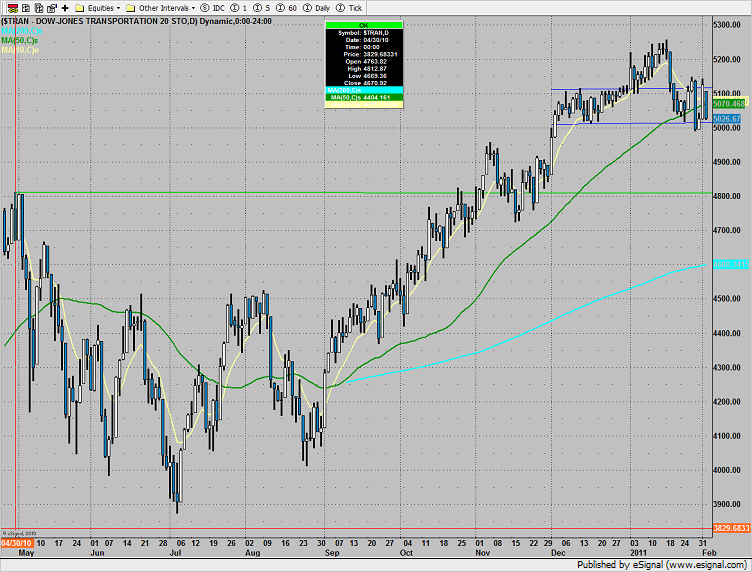
The Dow Transports are dangerously close to a breakdown. Down 2% on the day the TRAN grossly underperformed the broad market.
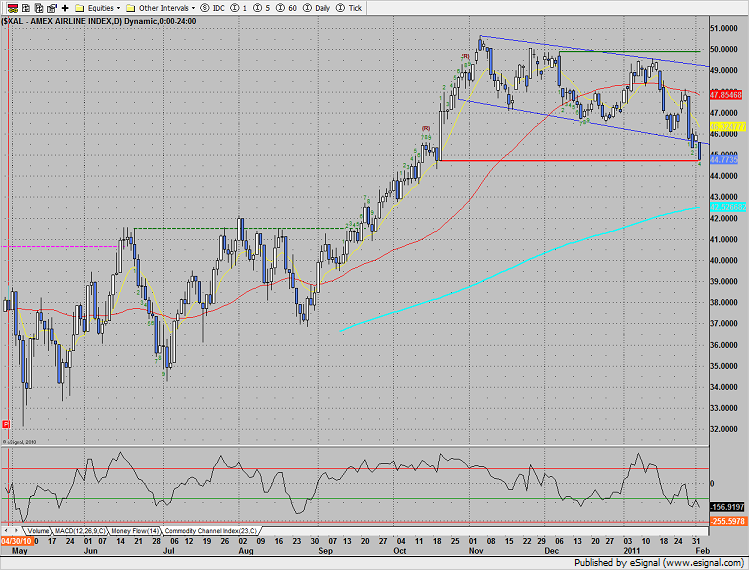
The airline index, XAL, is at the last level of support before a breakdown. The static trend line is the last area of support before a trip to the 200dma and August highs. Note that the bar count is only 4 days down and price is already interacting with the static trend line. This is generally bearish.
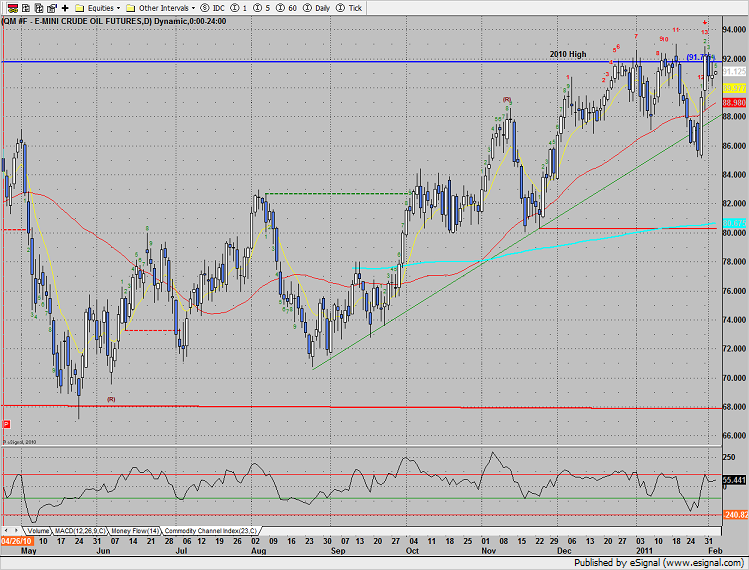
Oil:
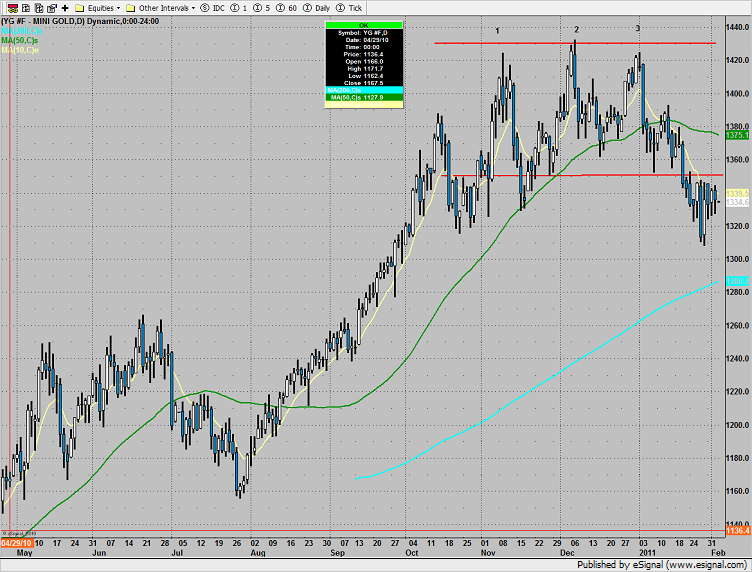
Gold:
Tradesight Market Preview for 2/3/11
February 2, 2011
|In Tradesight