Tradesight is pleased to announce the launch of the latest version of the Tradesight Futures Levels Tool for e-Signal, which includes the introduction of the new Tradesight Pressure Threshold Levels. In addition, the Futures tool and Futures Levels service now covers the ES (S&P e-mini), NQ (NASDAQ e-mini), YM (Dow e-mini), ER/TF (Russell 2000 e-mini), YG (gold e-mini), and QM (crude oil e-mini) contracts. Additional contracts are coming soon.
The tool now includes exciting features such as backtesting, Value Area shading, on/off toggles for each line, and more. In addition, the Pivot series Levels, which we calculate based on contract settlement and not market hours, have been expanded from R2, R1, Pivot, S1, and S2 to now include R3 and R4 and S3 and S4.
The key starred levels have changed from three tri-star levels and two dual-star levels to four tri-star levels.
Therefore, each contract now has a value for each of the following:
Breaks (UBreak and LBreak) – Key Murrey Math levels that bracket the market above and below each day, considered by many to be the most important number to know coming into the session.
Pressure Thresholds (UPT and LPT) – Threshold levels that serve as support and resistance, but are also a proprietary calculation from Tradesight that shows the likelihood of a gap fill.
Value Areas (VAH and VAL) – Market profile values that indicate the high and low of where 70% of the trading action occurred in the prior session based on volume.
Settlement-Based Pivot Series – R4, R3, R2, R1, Pivot, S1, S2, S3, and S4 for each contract. These are traditionally support and resistance points for trade management.
Tri-starred Levels – These four levels are “magnet” points for the market and also serve several purposes during trading when hit.
The tool now allow you to plug in any date and view the key levels for that date for back-testing purposes in e-Signal. Dates after 3/1/2012 show all levels. Dates prior to 3/1/2012 show only the Breaks and Value Areas.
The tool is available later this week on the site and will be used extensively in the new Tradesight Futures Course.
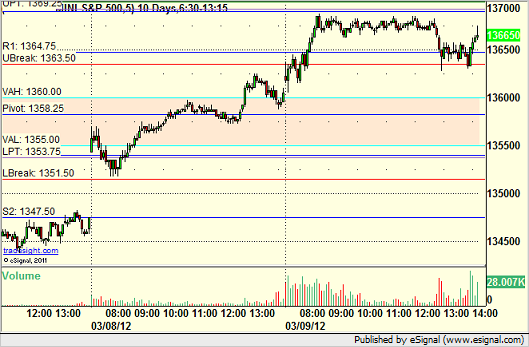
Here are two examples of the tool with the Value Area shaded in, first on the ES:
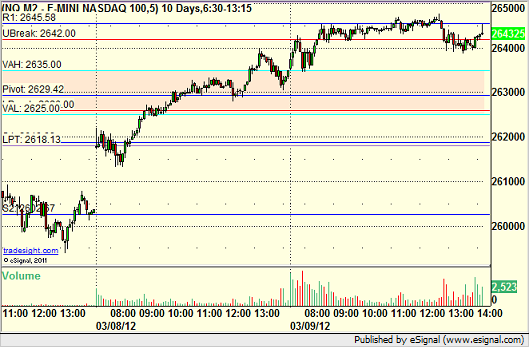
And then on the NQ:
Tradesight Launches New Futures Levels Tool for e-Signal and Tradesight Pressure Threshold Levels
March 11, 2012
|In Tradesight