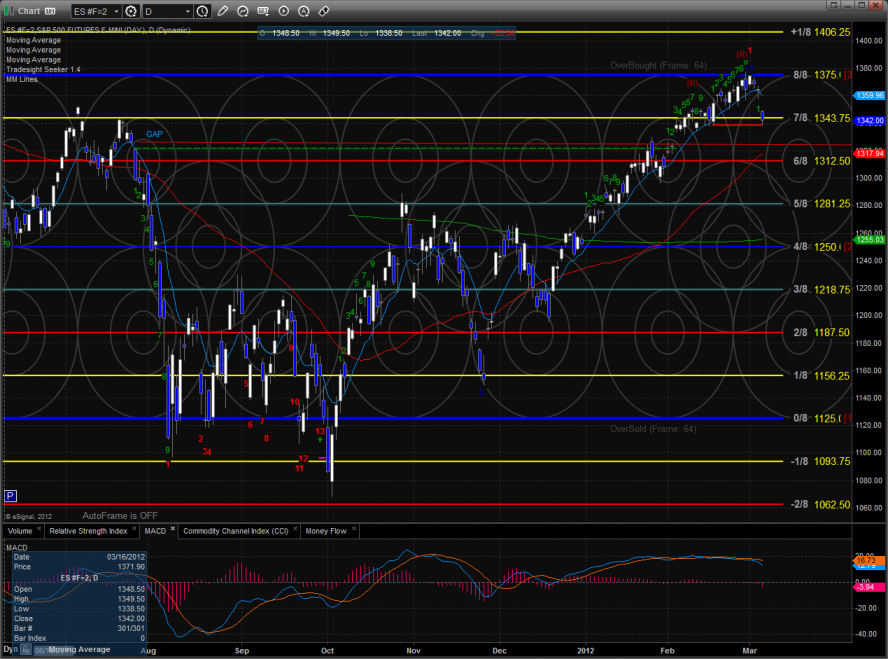
The ES gapped down significantly and proceeded to do nothing much. Price did settle below the open so this qualifies as a distribution day. Note how the chart used the static trend line for support. The next level of support is going to be the rising 50sma.
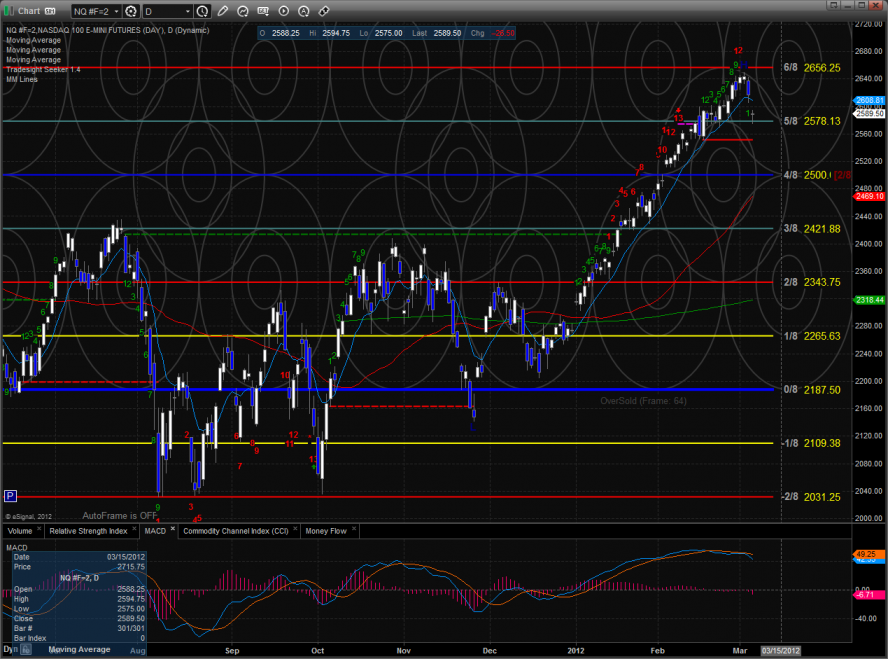
The NQ futures were lower on the day by 26 which made them relatively strong vs. the ES futures on the day. The active static trend line has not come into play and will be key support when it comes into range. The MACD could just be beginning to rollover which would put downside momentum into the pattern. Price closed below the short-term 10ema.
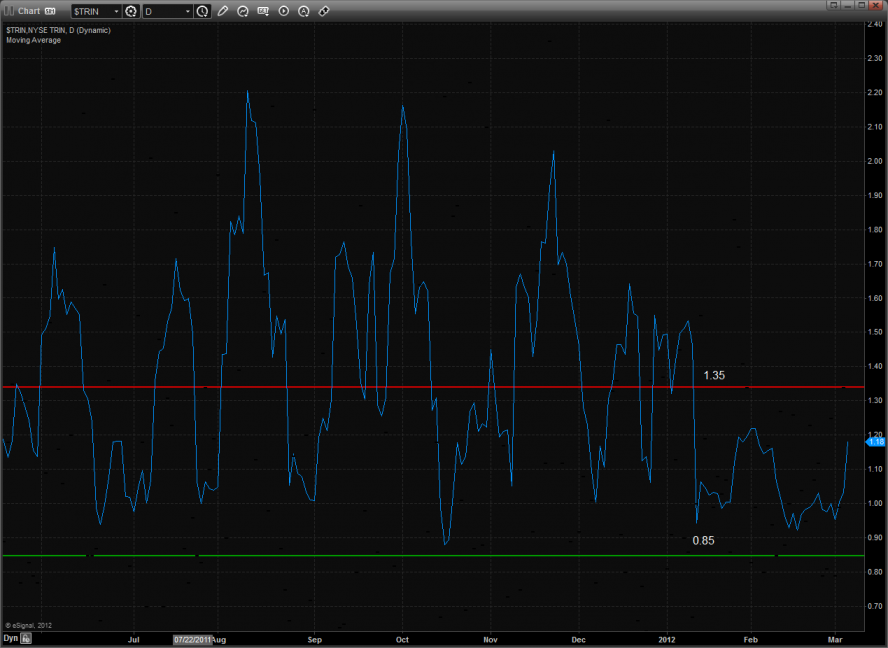
The 10-day Trin is climbing quickly.
The multi sector daily chart shows how the XAU members continue to get beat with the ugly stick.
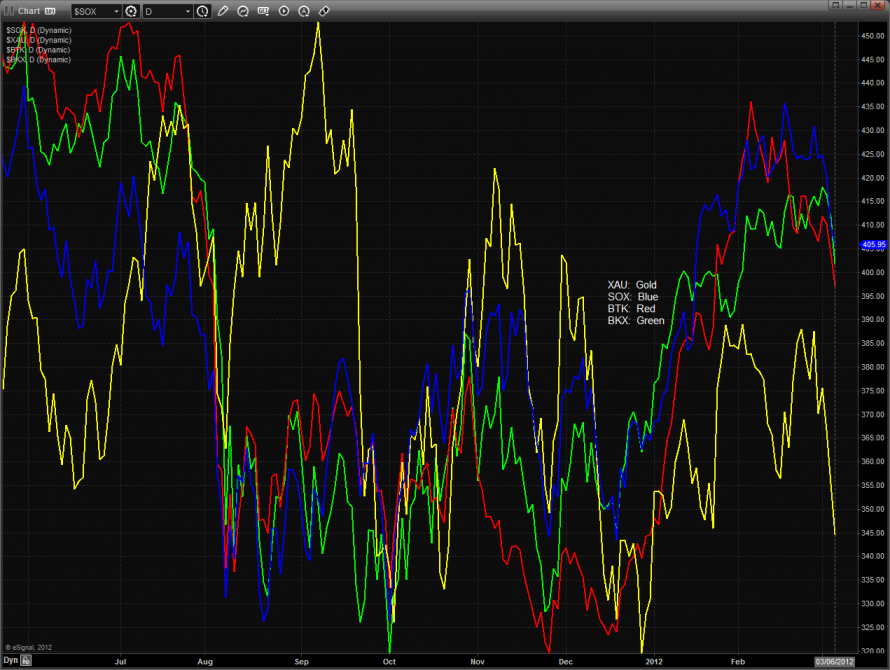
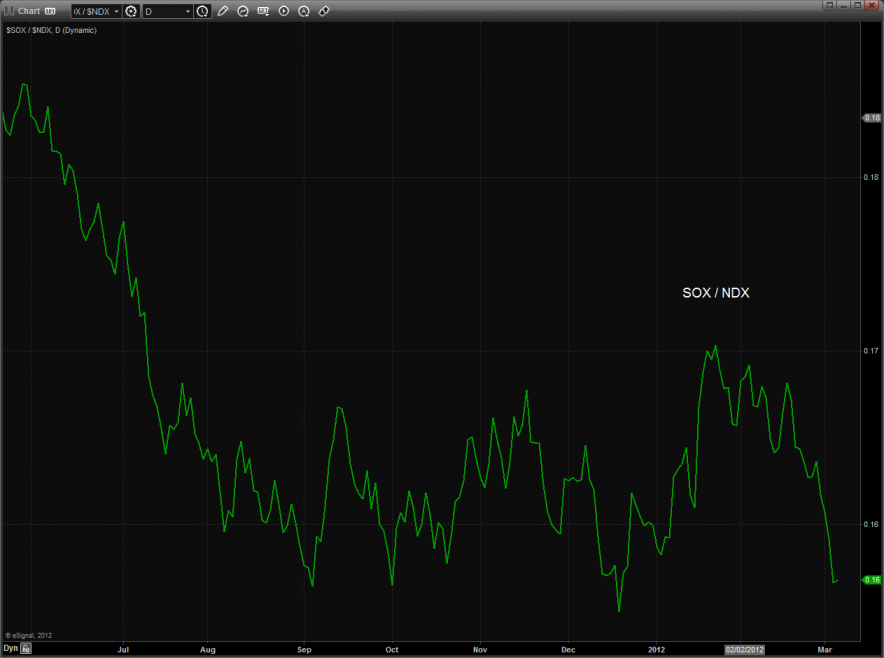
The SOX did not break to a new low vs. the NDX which is one of the small bright points on the day.
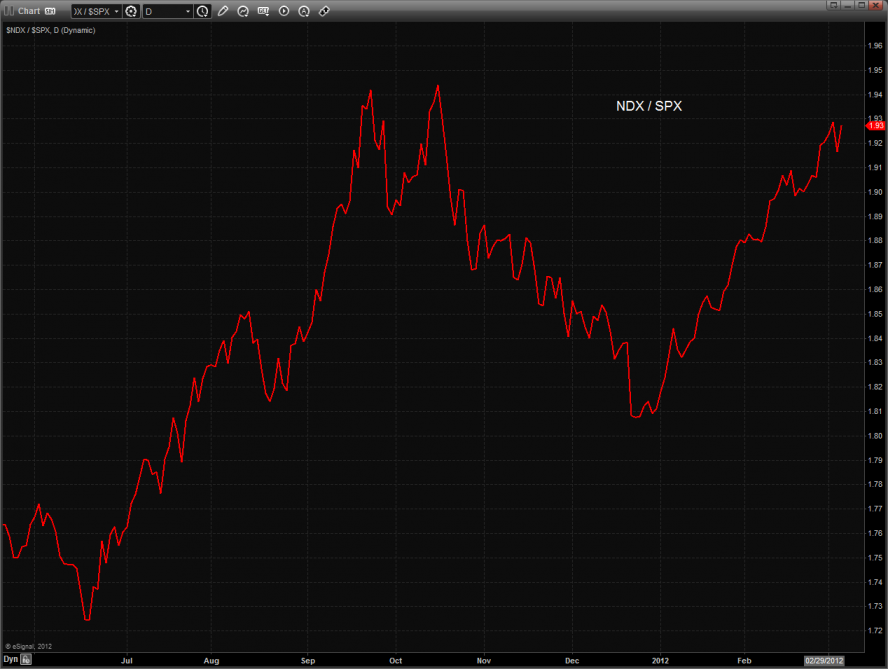
The relative strength in the NDX today can be clearly seen in the NDX/SPX cross. A real break and rollover would be confirmation that the bears have taken control of the market. This often takes time and we need to monitor this carefully. This is one of the intermarket keys that would put traders on guard that the change in trend will be a lasting one.
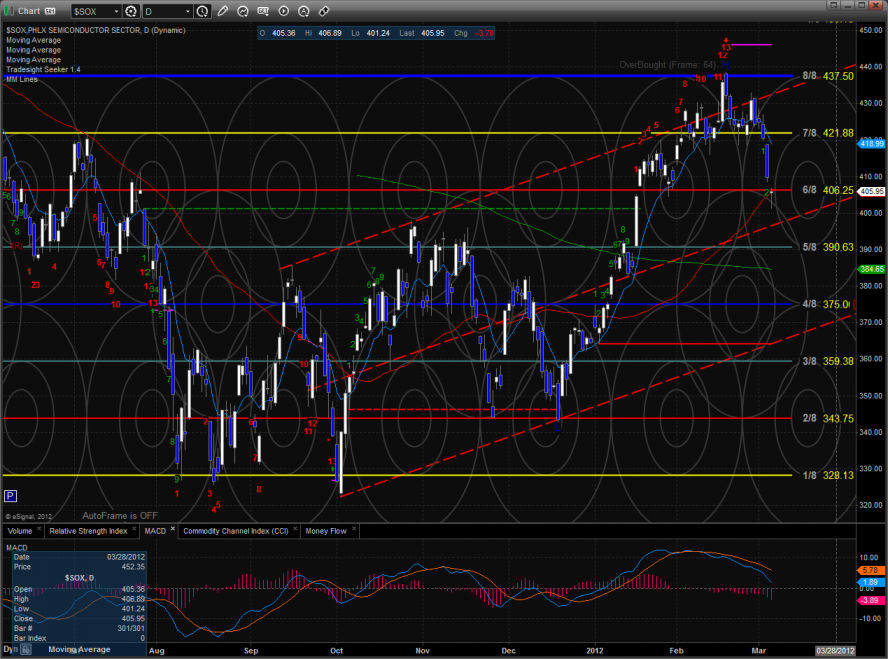
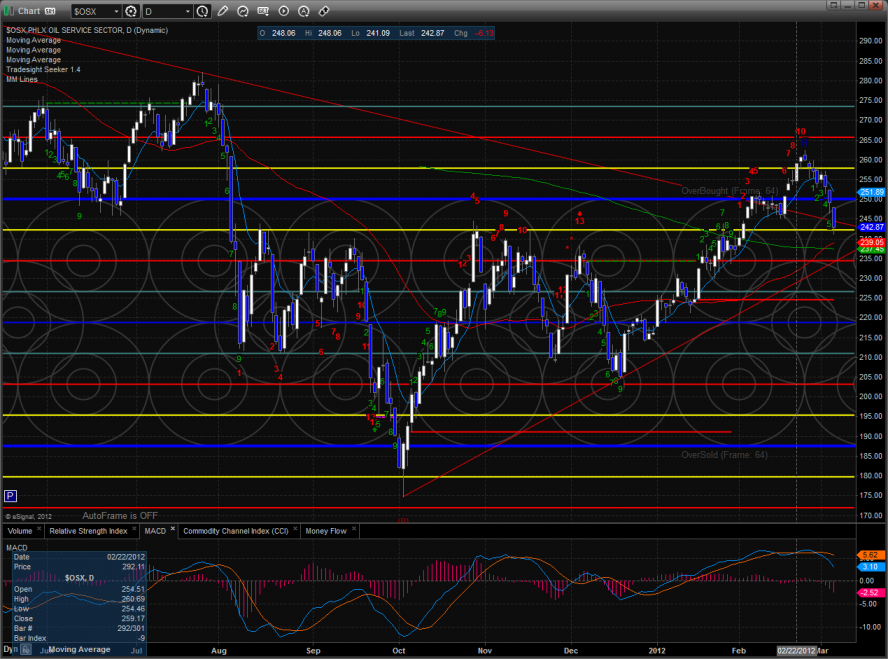
The SOX was the top gun on the day which means that it was the best of the bad. Price is currently using the 50dma for support. The measured move target off the H&S pattern projects down to about 395 which has not traded yet.
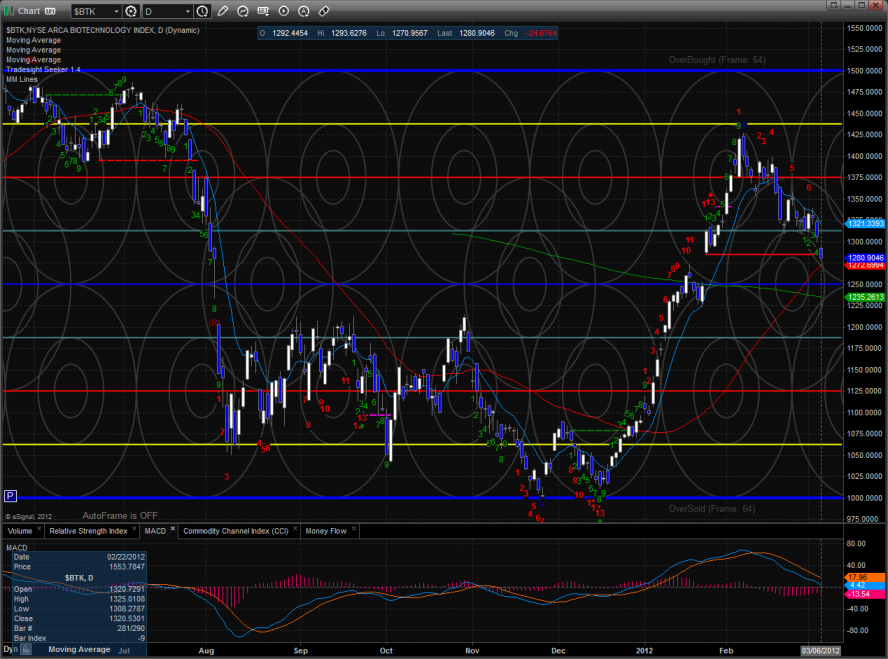
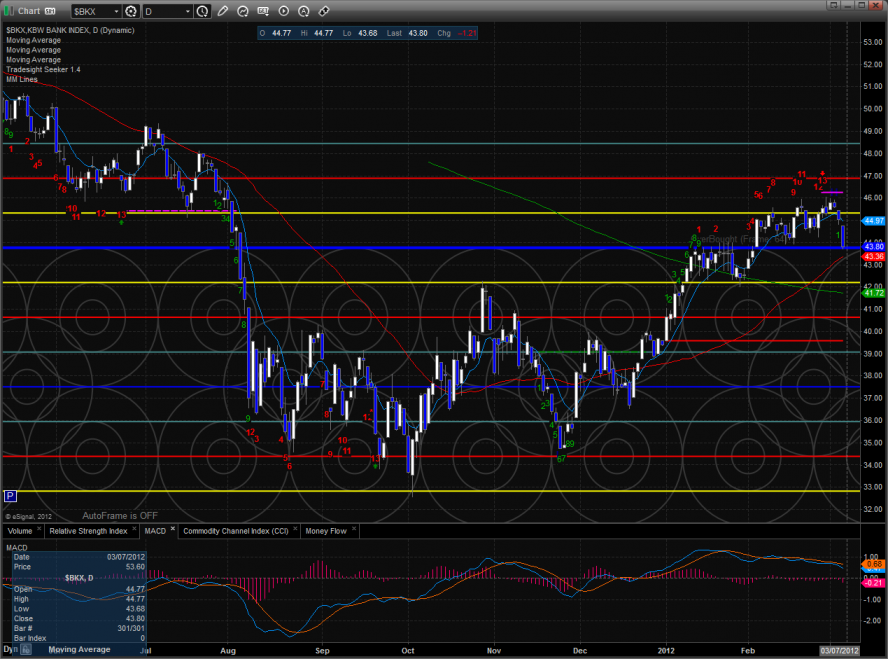
The BTK has come into first support at the 50dma. The Seeker count is only 5 days down so it is still very possible for the 200dma to come into play.
The OSX has key support just a little below Tuesday’s low where the 50 and 200dmas converge. If price breaks below the lower boundary of the old pennant and the MACD breaks the zero line, look out below.
The BKX was weaker than the broad market. Keep in mind that he 13 exhaustion signal is still active and hasn’t really influenced price yet. The typical expectation of a counter move is a 9 bar move in the direction of the signal.
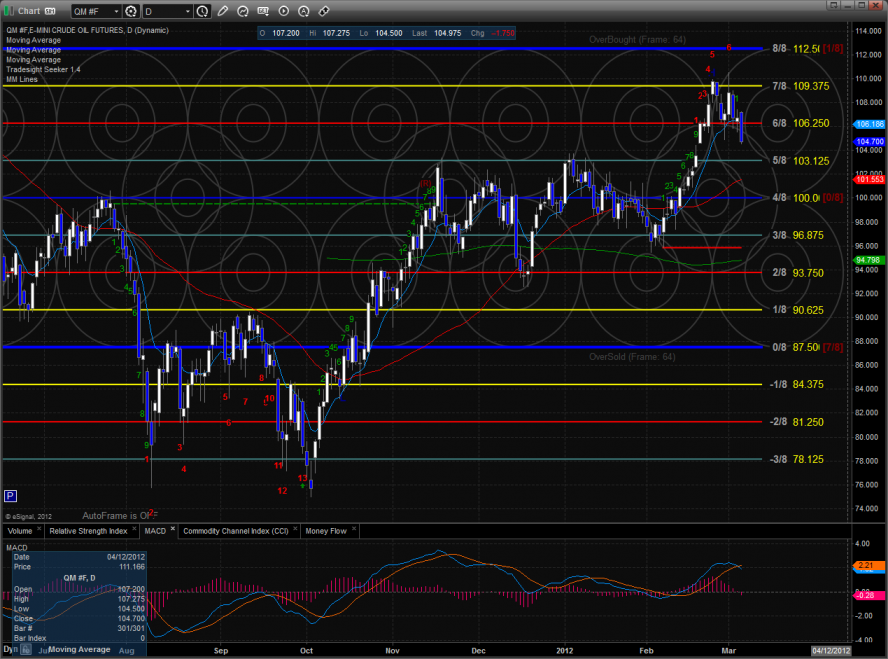
Oil:
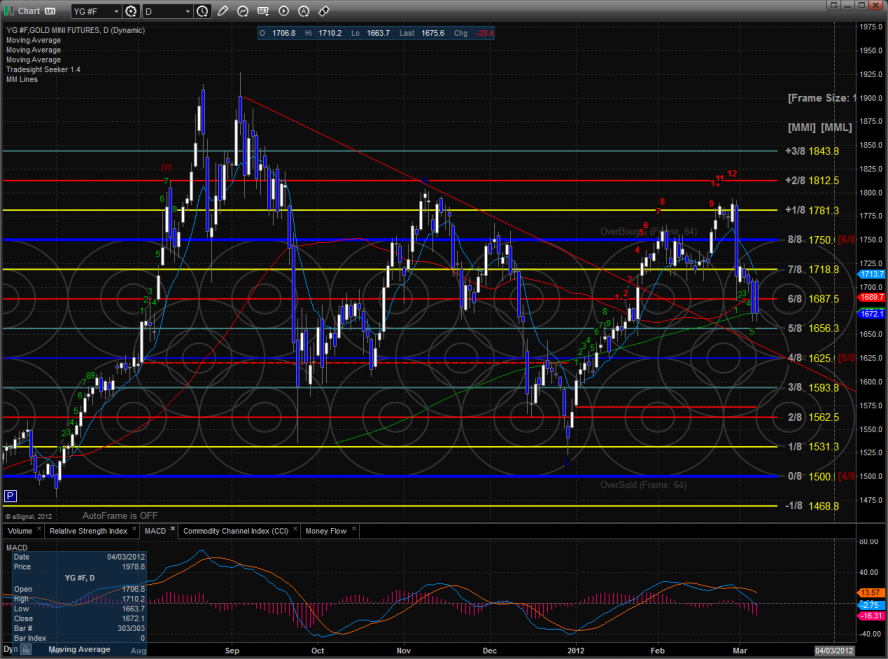
Gold:
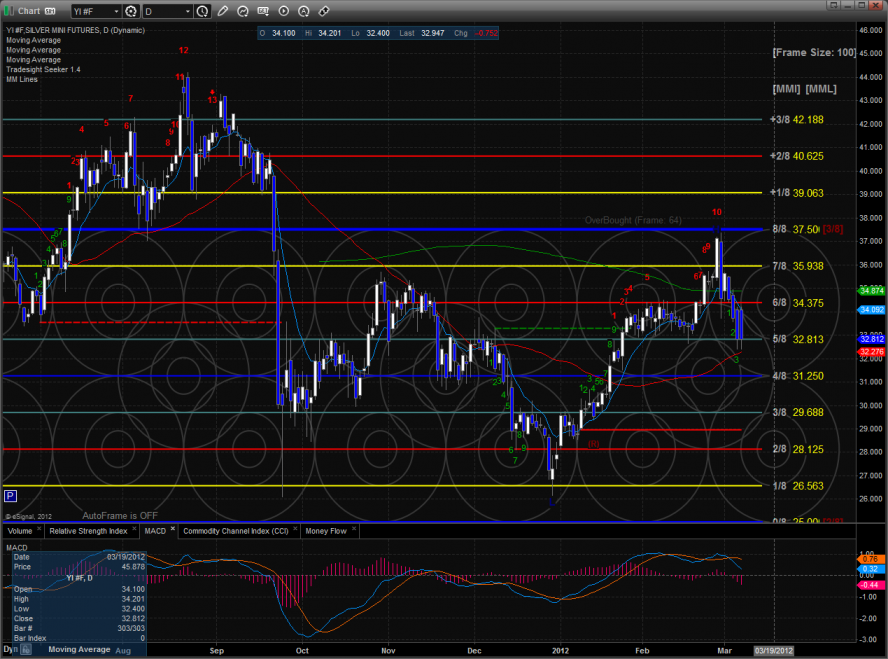
Silver:
Tradesight.com Market Preview for 3/7/12
March 6, 2012
|In Tradesight