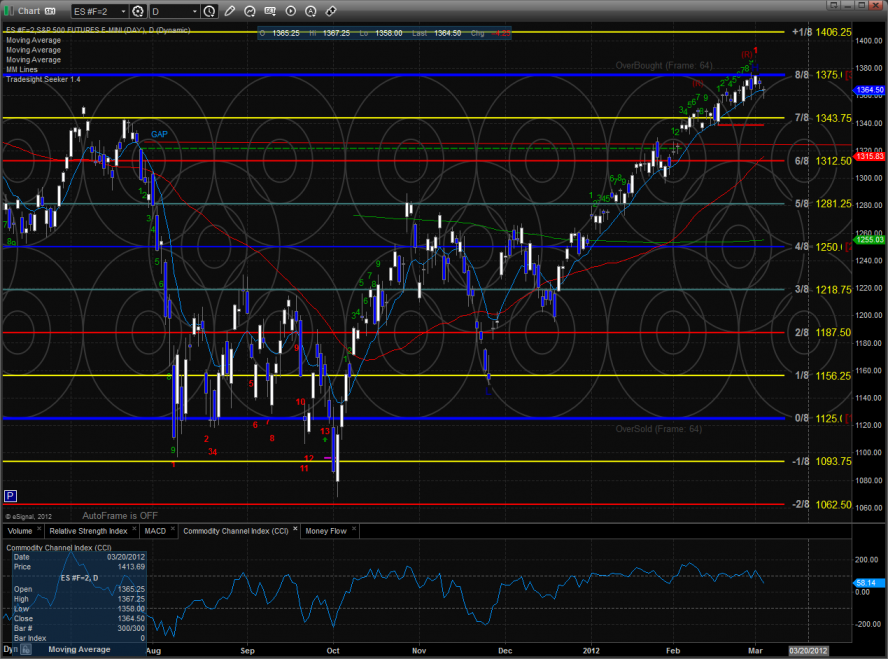
The ES continues to have trouble with the 8/8 level and Monday gave back 4 handles. Price settled right on the important 10ema. A close below this level would be the first sign of a short-term change in trend.
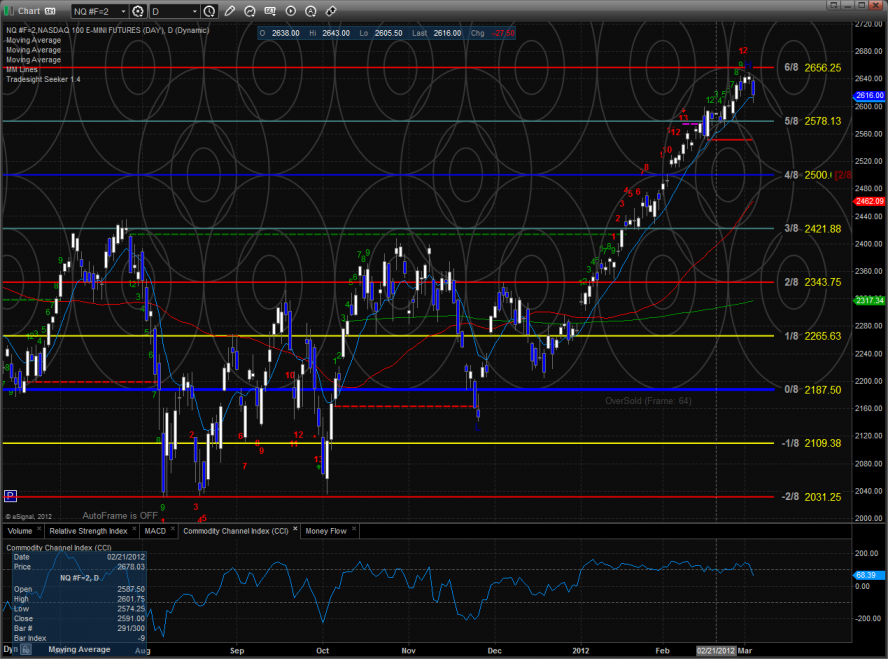
The NQ futures we also lower on the day and settled right around the 10ema. Keep in mind that the Seeker 9-13-9 pattern has not yet released any of its energy to the downside. The first target after a CIT will be the active static trend line around 2550.
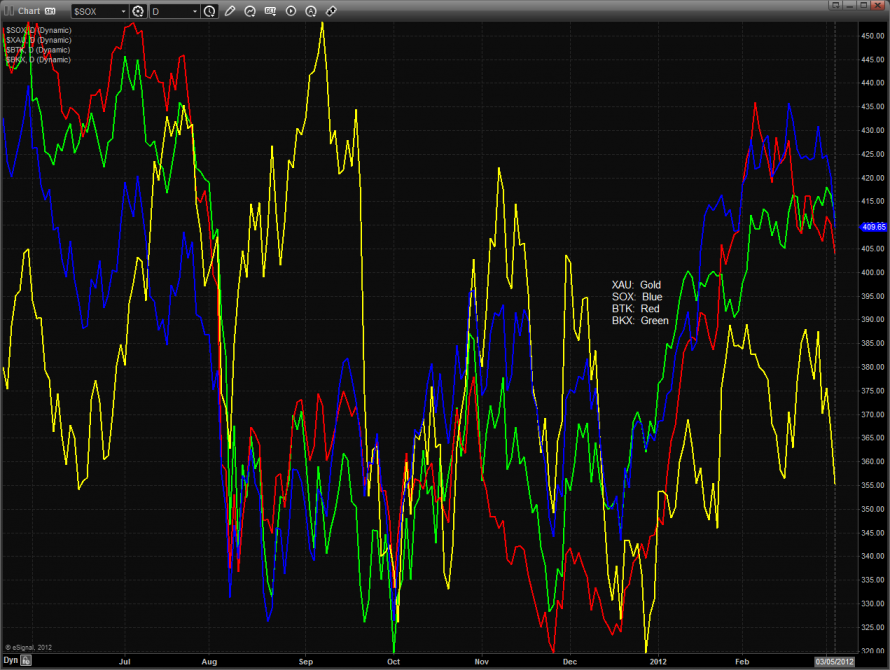
Multi sector daily chart:
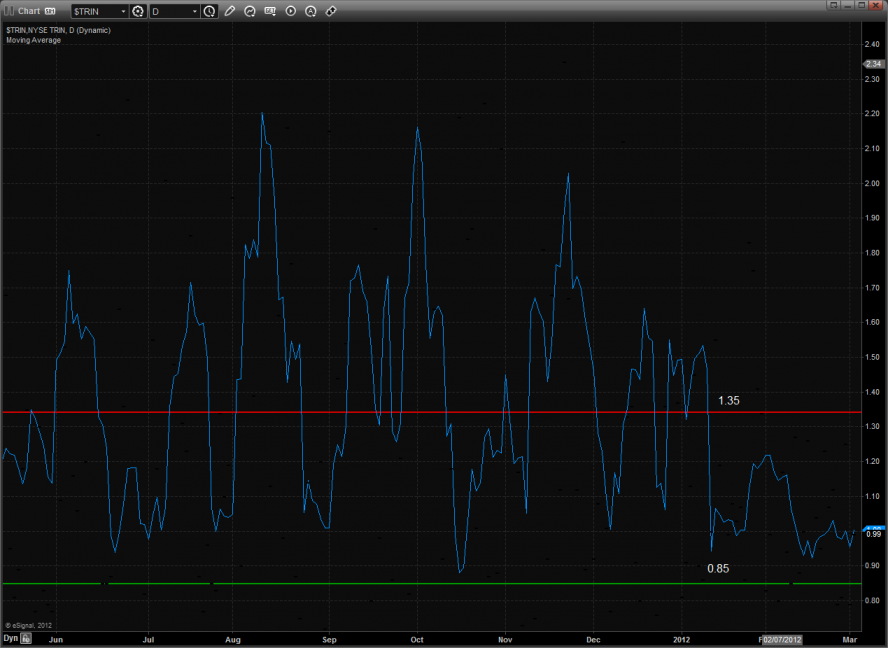
The 10-day Trin is still neutral:
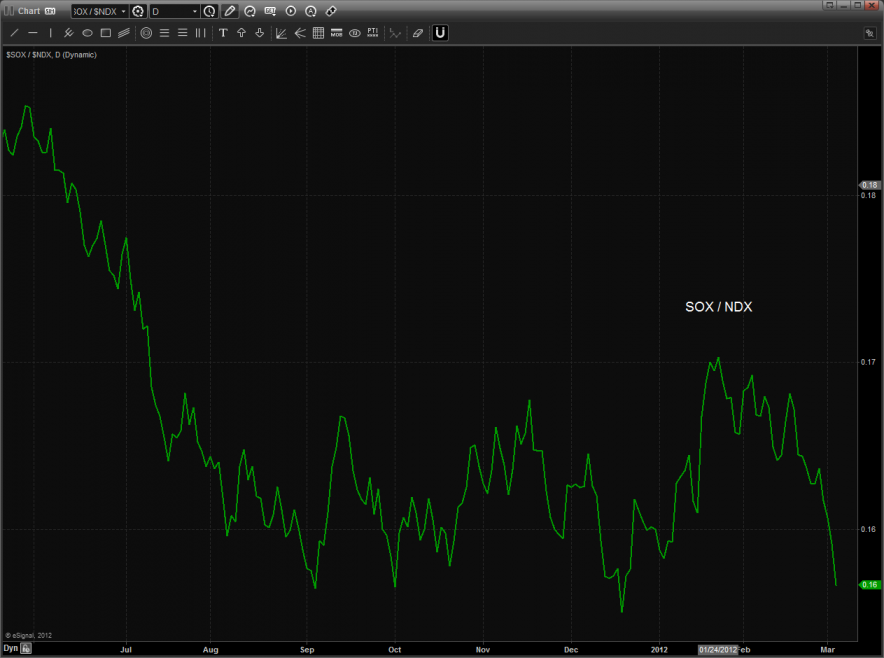
The SOX/NDX cross pair took a huge hit. A break to a new low would be bearish and likely break the broader NDX100.
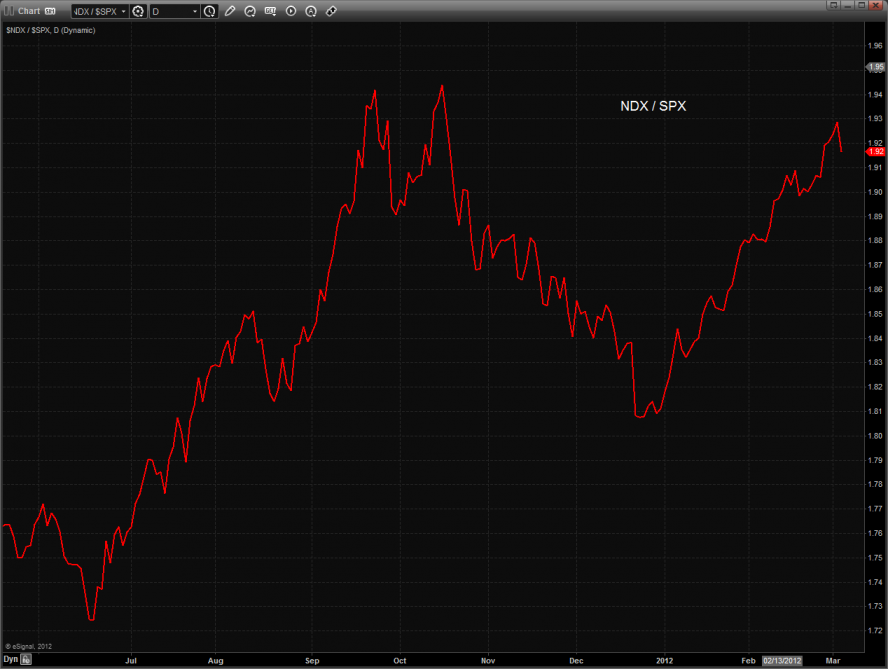
The NDX/SPX cross is also flashing a warning sign. The chart has yet to produce a new high where the relative strength of the NDX could really assert itself and now it could possibly be rolling over. A break under 1.90 will be the deal breaker.
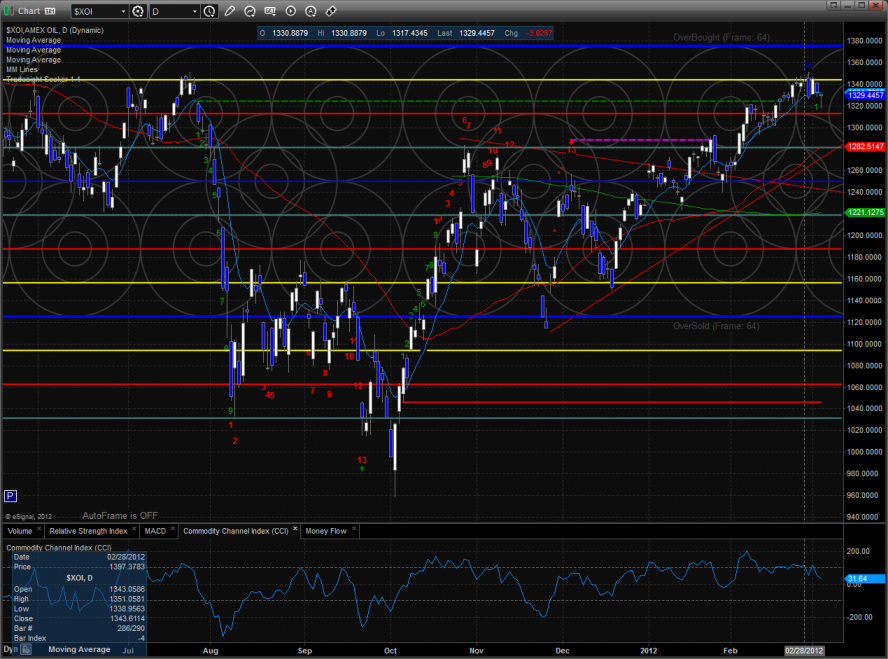
The XOI was the best performing sector. It was lower on the day by a fraction but bullishly closed near the high.
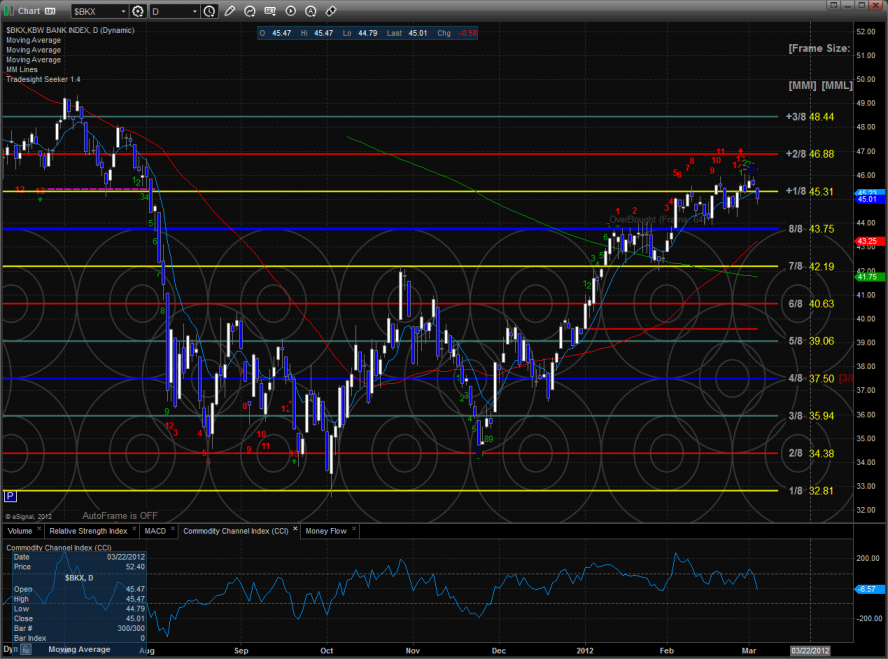
The BKX is still range bound but there is still an active Seeker sell signal that has yet to influence price.
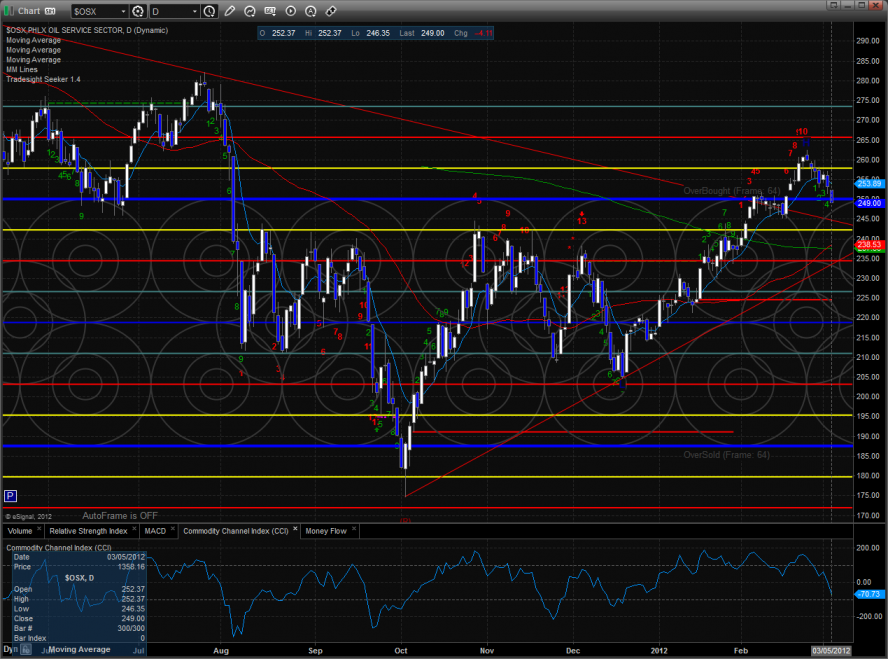
The OSX is backing off and should find better support after it gets back into the pattern and near the moving averages which are all in the same price neighborhood.
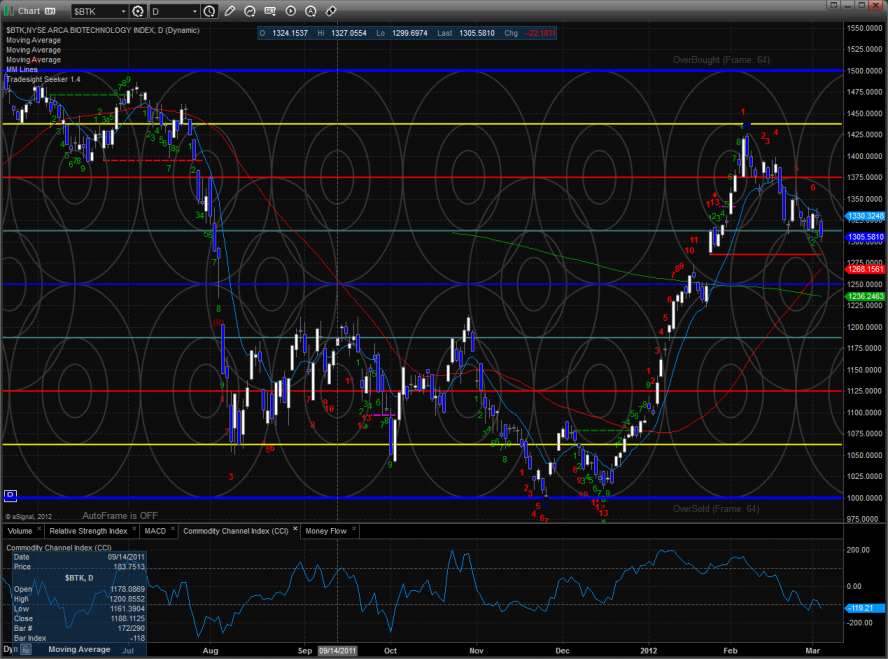
The BTK continues to roll over and is getting closer to first support at the static trend line (red). Keep in mind that with the gap on the chart the static trend line level is very important and will be an important break level if breeched.
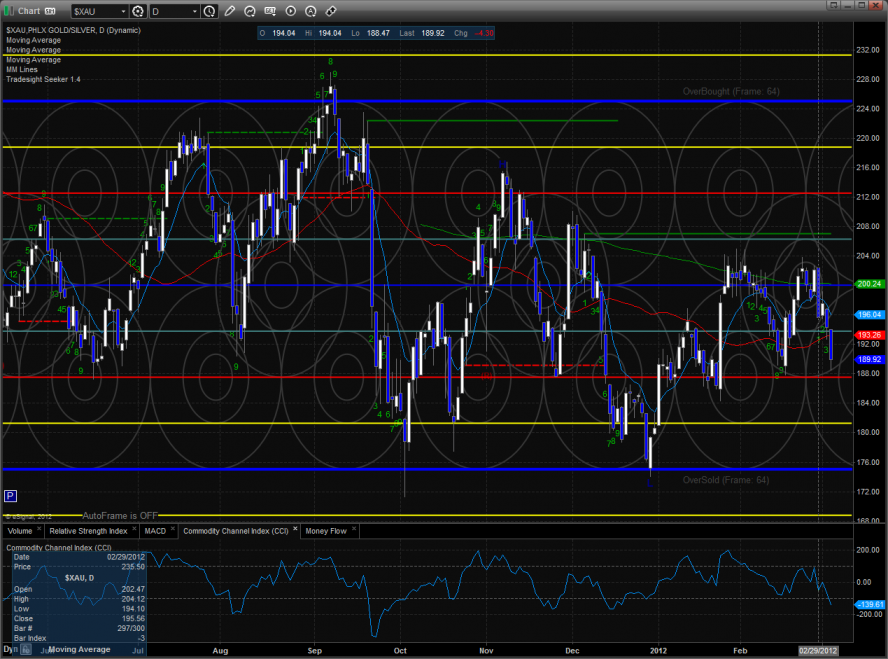
The XAU offered little safety and was much weaker than the major averages on the day. The chart continues to print lower high after lower high.
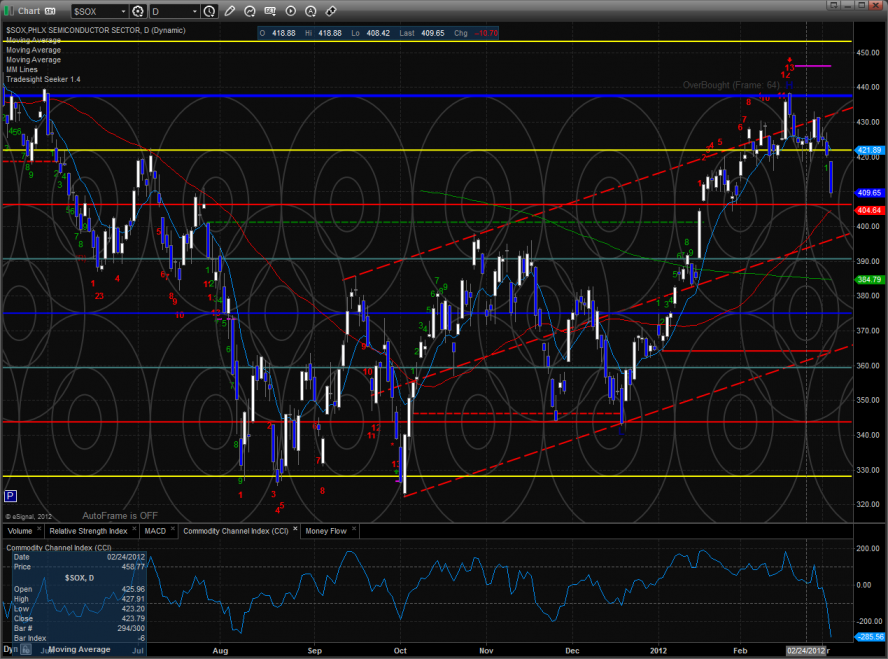
The SOX was the last laggard on the day and broke through the neck line of the head and shoulders pattern. This projects price roughly down to the midpoint of the trend channel for the typical H & S measured move.
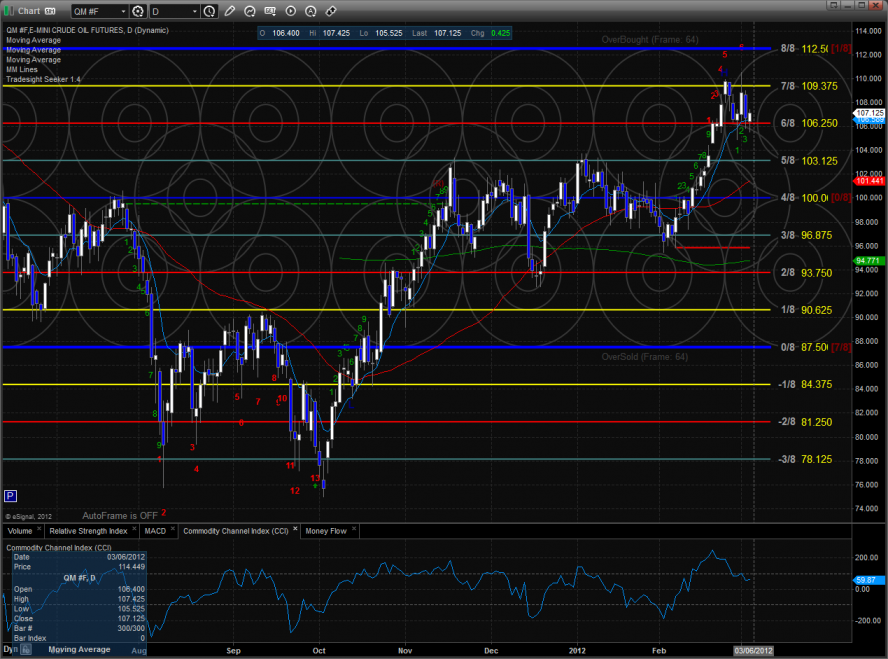
Oil:
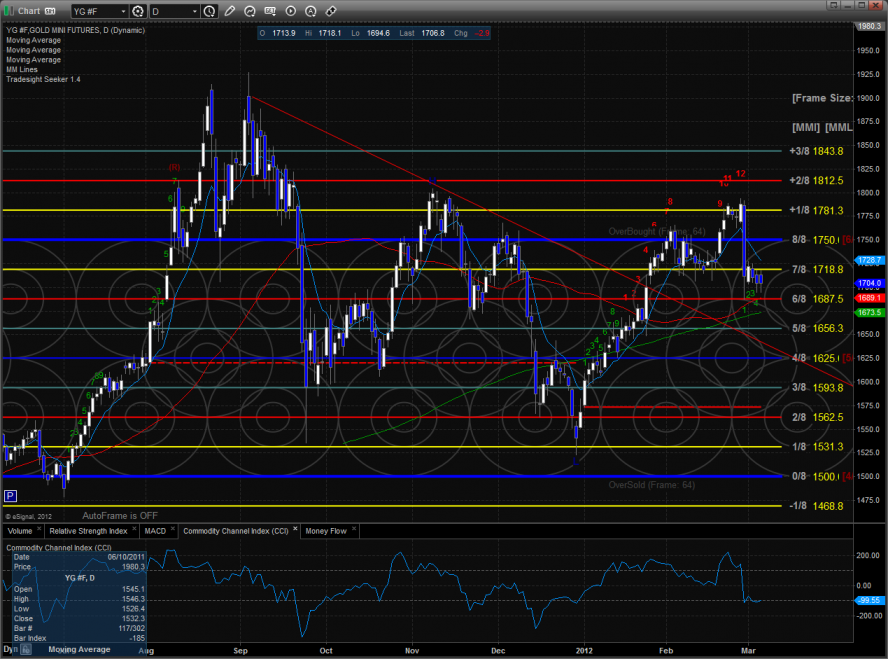
Gold:
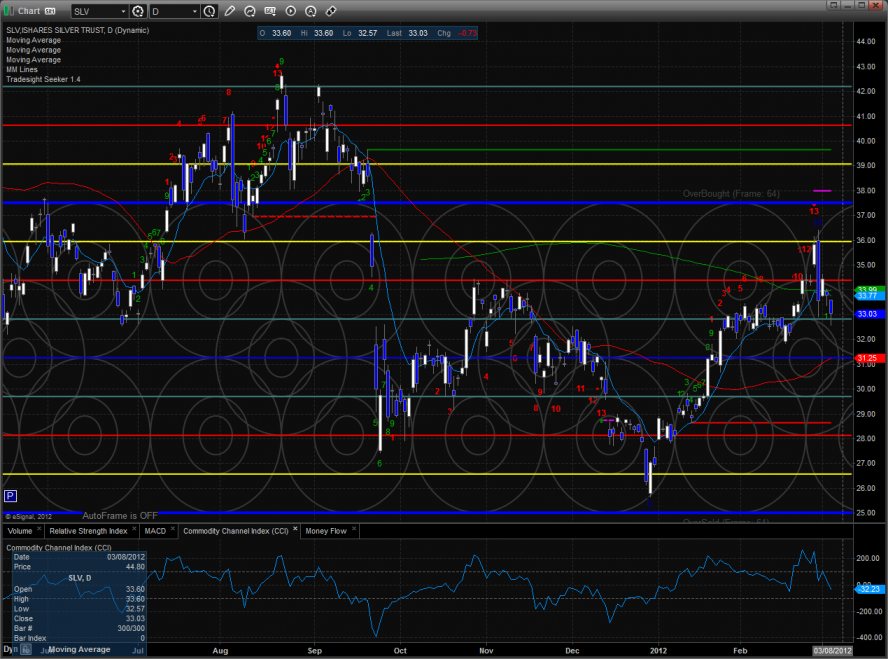
SLV:
Tradesight.com Market Preview for 3/6/12
March 5, 2012
|In Tradesight