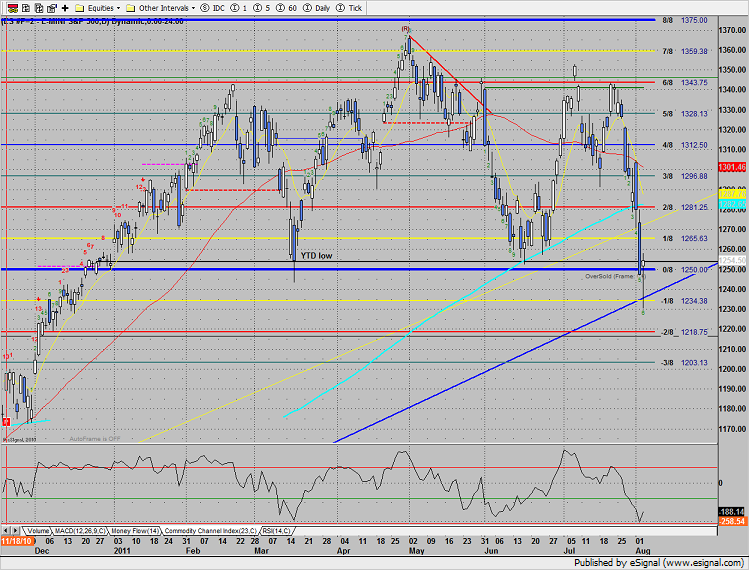
The SP closed higher on the day after posting some steep intraday losses. The bulls were able to reclaim the 1250 0/8 level which means little unless price follows through after the Friday NFP #.
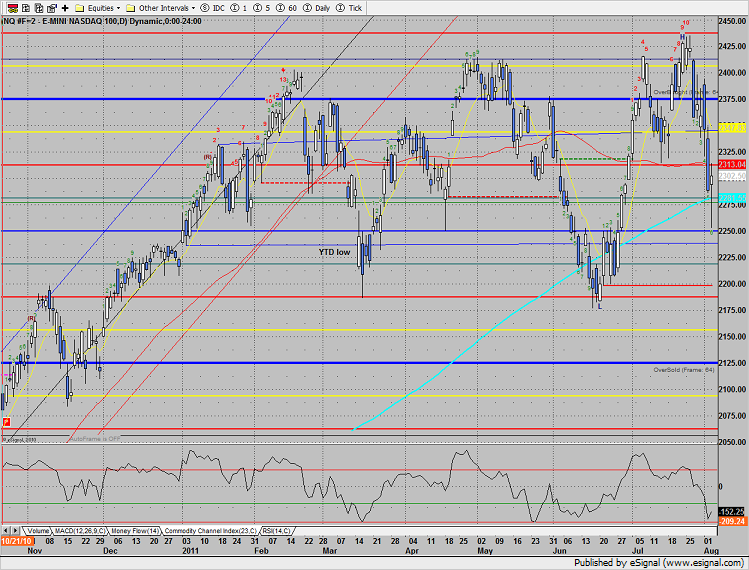
Naz also posted a higher close keeping on the north side of the 200dma. Note that if price continues higher this will be a higher low on the Naz chart where the SP side was a lower high. This favors the Naz and the relative strength should be used as an opportunity.
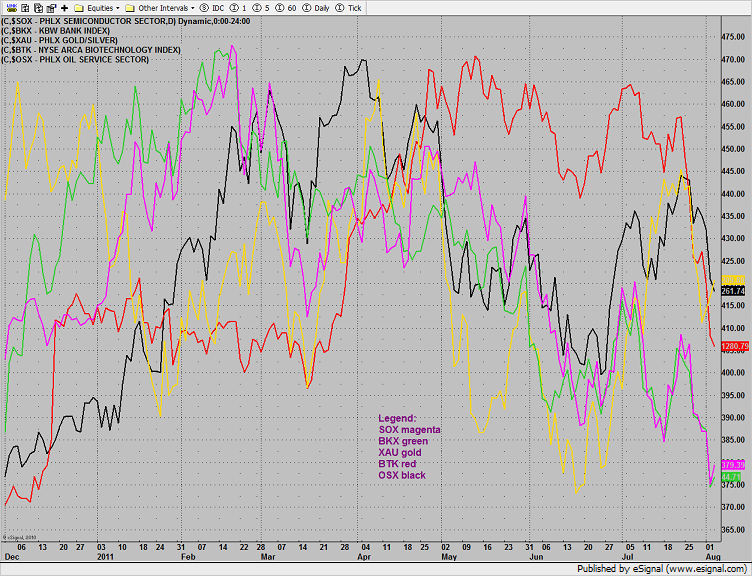
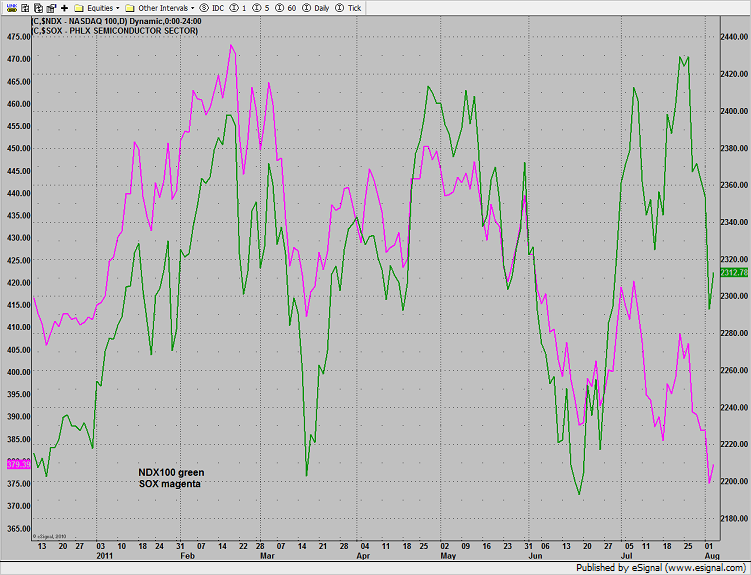
Multi sector daily chart:
The relative performance of the NDX vs. the SPX has developed a very bullish divergence–bullish in general for equities.
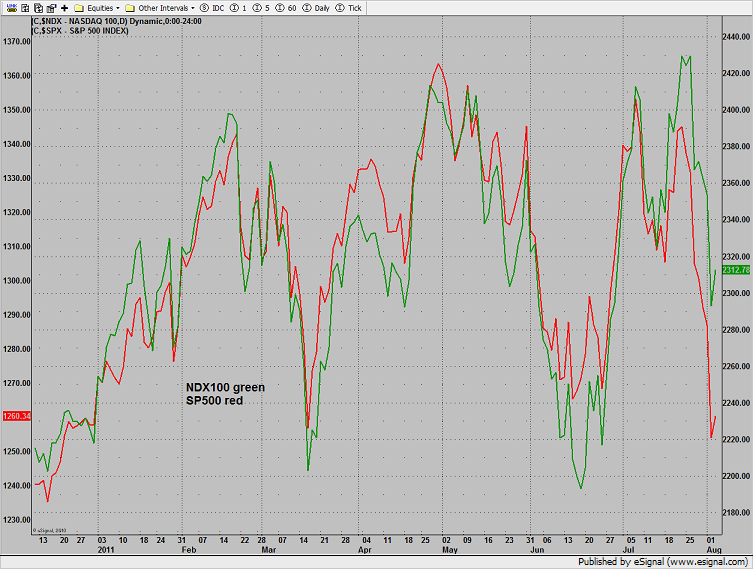
The SOX continues to lag the NDX which is usually bearish for the NDX which implies that the market is not going to breakout but be range bound with a positive divergence so favor a bounce in broad market equities.
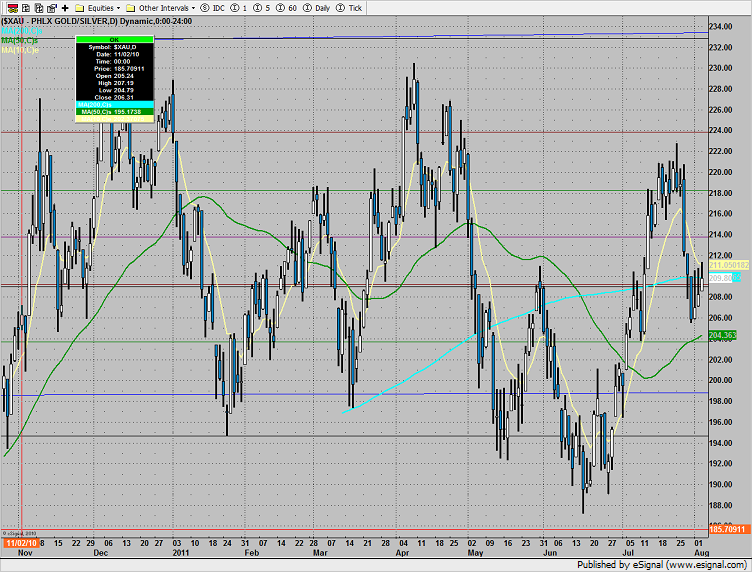
The XAU was in the middle of the pack, closing right at the 200dma.
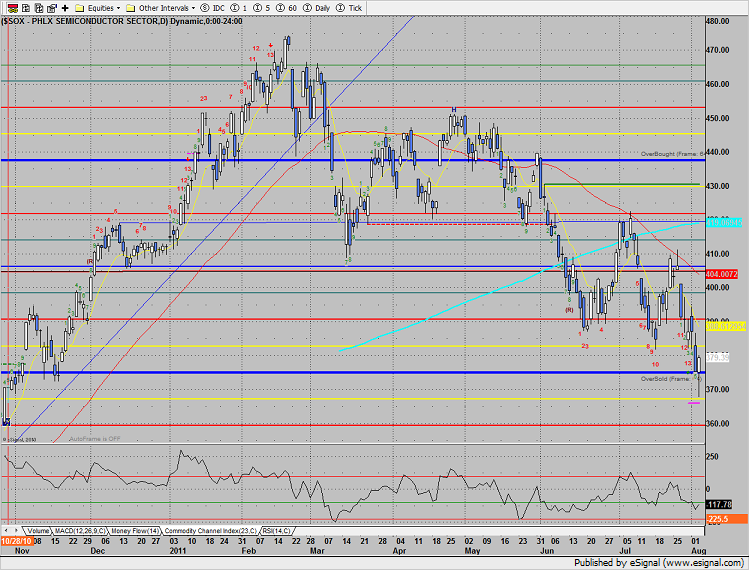
The SOX was top gun on the day, opening and then closing above the 0/8 Gann level. Note that the Seeker exhaustion buy signal is still active.
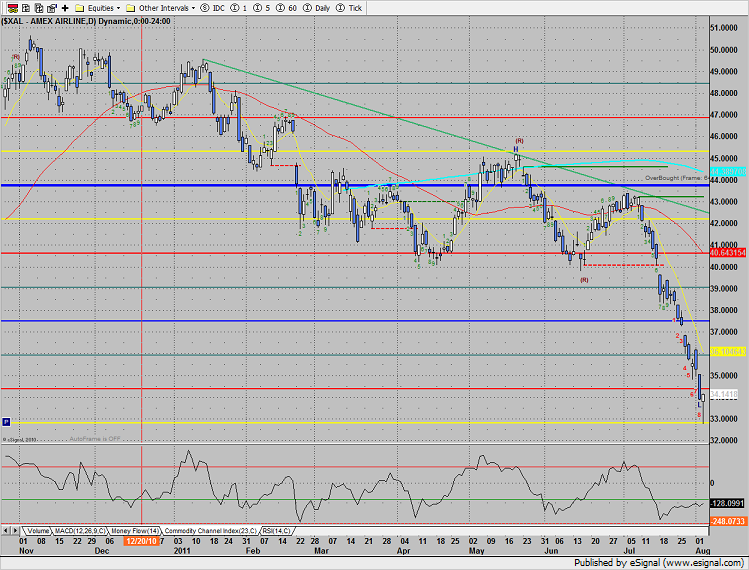
The XAL closed at the high of day after making a new low on the move. Watch this sector for a continuation of the bounce in progress.
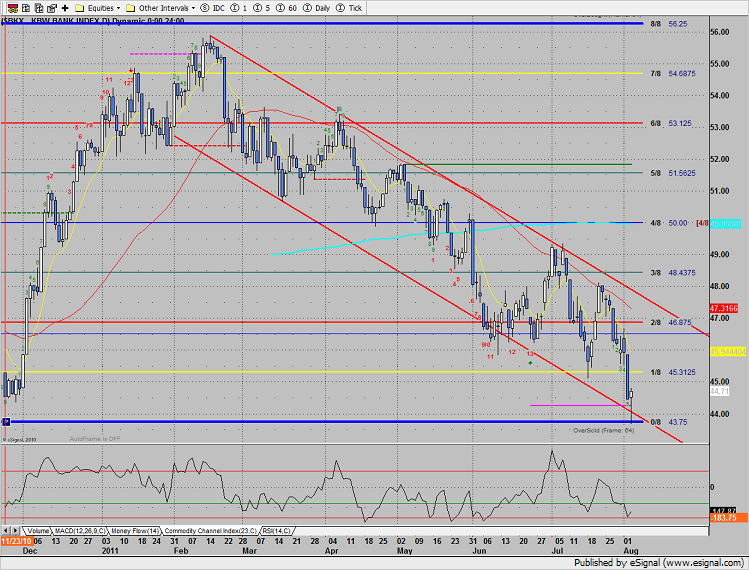
The BKX used a double level for support. The 0/8 level and the lower channel should provide support in the short term.
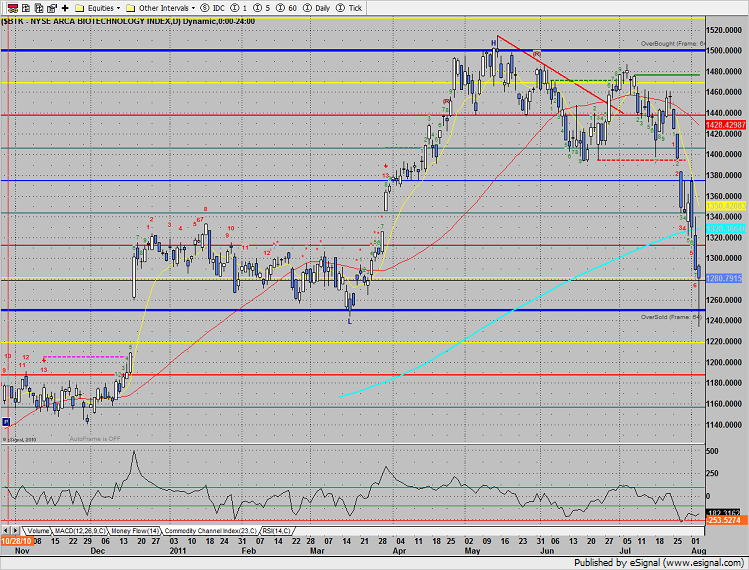
The BTK was very weak and was one of the few sectors to close lower on the day. The chart is very short term oversold and could bounce back to the 200dma.
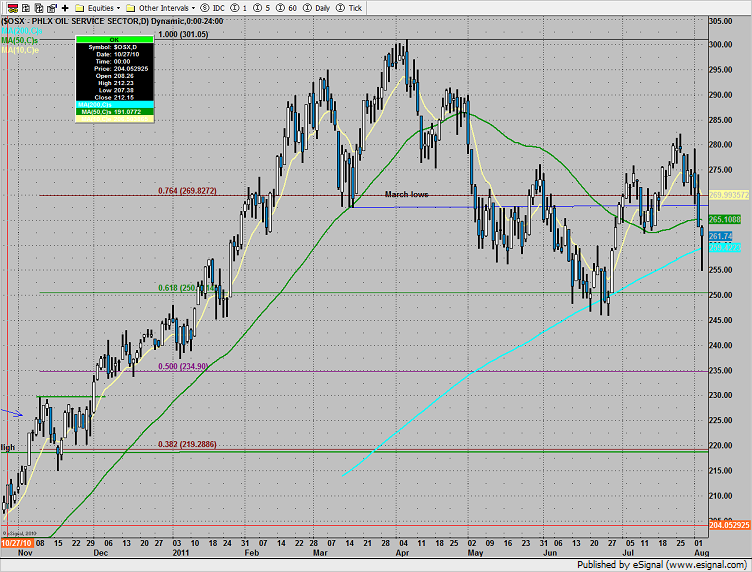
The OSX was last laggard on the day but remains relatively strong vs. the broad market. Price remains on the positive side of the 200dma.
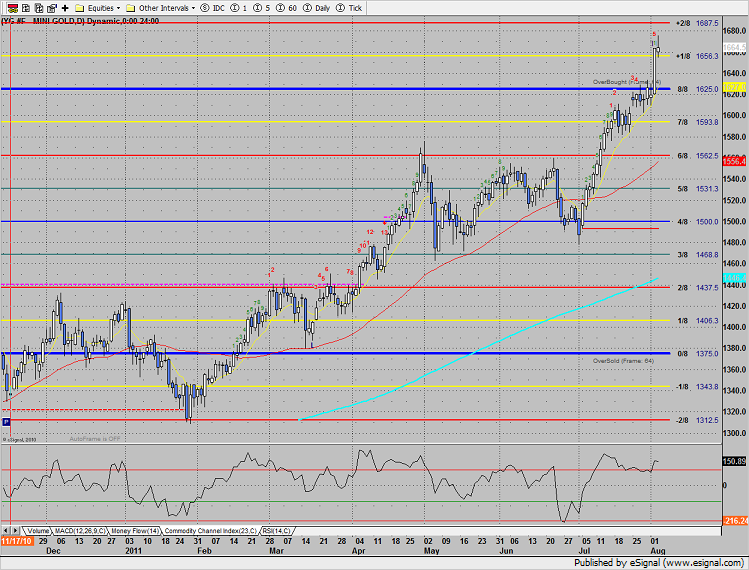
Gold continues was high very close to the over bought +2/8 level
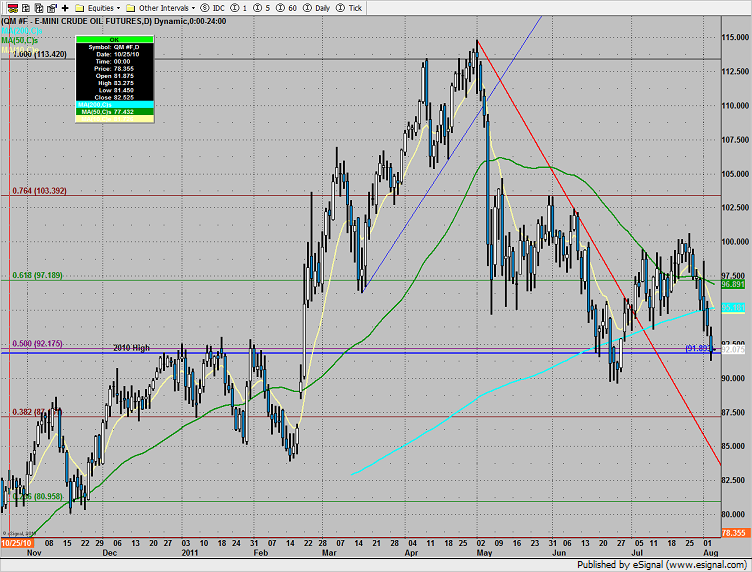
Oil was lower on the day, closing at the 2010 high.
Tradesight Market Preview for 8/4/11
August 3, 2011
|In Tradesight
Tradesight Market Preview for 8/4/11
August 3, 2011
|In Tradesight
The SP closed higher on the day after posting some steep intraday losses. The bulls were able to reclaim the 1250 0/8 level which means little unless price follows through after the Friday NFP #.
Naz also posted a higher close keeping on the north side of the 200dma. Note that if price continues higher this will be a higher low on the Naz chart where the SP side was a lower high. This favors the Naz and the relative strength should be used as an opportunity.
Multi sector daily chart:
The relative performance of the NDX vs. the SPX has developed a very bullish divergence–bullish in general for equities.
The SOX continues to lag the NDX which is usually bearish for the NDX which implies that the market is not going to breakout but be range bound with a positive divergence so favor a bounce in broad market equities.
The XAU was in the middle of the pack, closing right at the 200dma.
The SOX was top gun on the day, opening and then closing above the 0/8 Gann level. Note that the Seeker exhaustion buy signal is still active.
The XAL closed at the high of day after making a new low on the move. Watch this sector for a continuation of the bounce in progress.
The BKX used a double level for support. The 0/8 level and the lower channel should provide support in the short term.
The BTK was very weak and was one of the few sectors to close lower on the day. The chart is very short term oversold and could bounce back to the 200dma.
The OSX was last laggard on the day but remains relatively strong vs. the broad market. Price remains on the positive side of the 200dma.
Gold continues was high very close to the over bought +2/8 level
Oil was lower on the day, closing at the 2010 high.