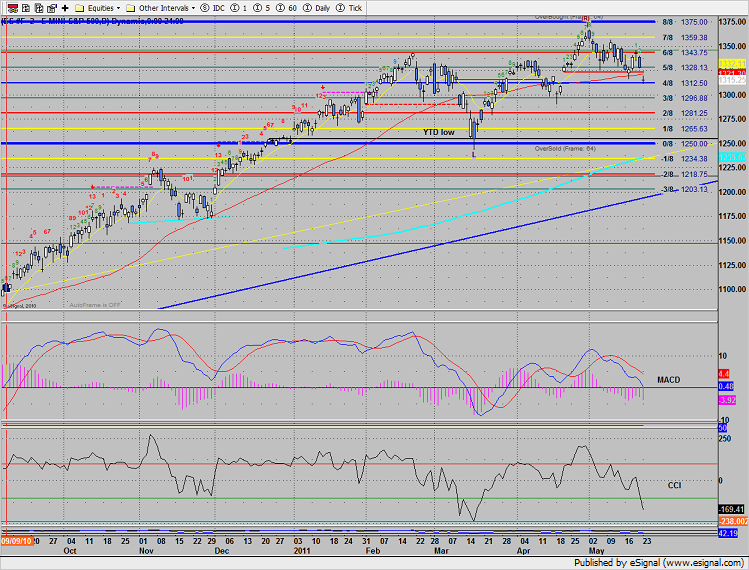
Taking a cue from the overseas equity price action, the SP gapped down and closed almost exactly where the session opened. This makes for limited opportunities intraday and a tough trading environment. There is more meaningful economic data coming later in the week so there should be more intraday volatility coming. The SP settled just above the 4/8 level of 1312.50 but has lost the static trend line and 50dma. In the chat below two studies have been stacked for evaluation. The MACD has come into the key zero line. This is either where support comes in or where price continues and downside momentum builds. The next two sessions will be very important. The CCI is oversold but not climatically so implying that there is both some oversold bounce potential as well as short term momentum exists. Keep in mind that the CCI tends to lead price while the MACD is a lagging or confirming indicator.
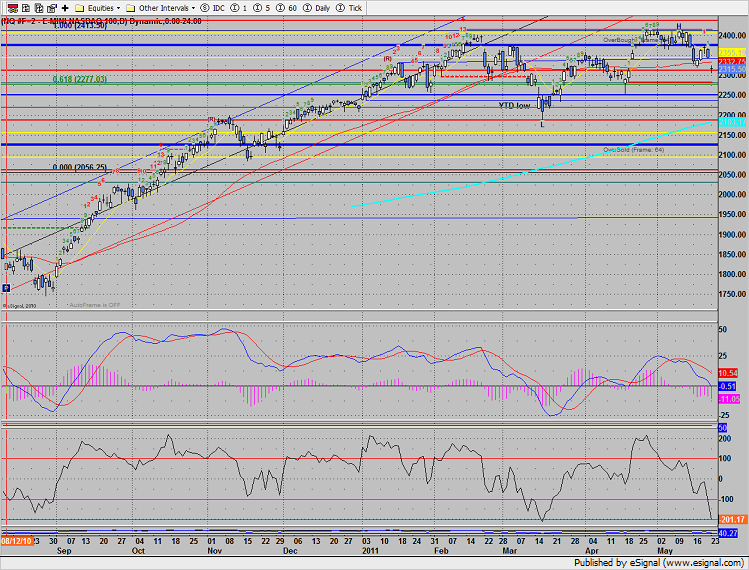
Naz has a very similar internal design compared to the SP. Note that the Naz CCI is climatically oversold reading <200.
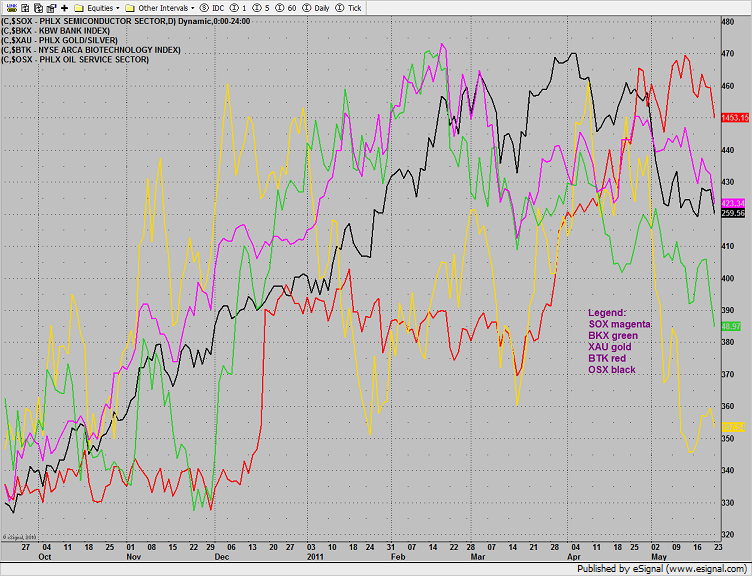
Multi sector daily chart:
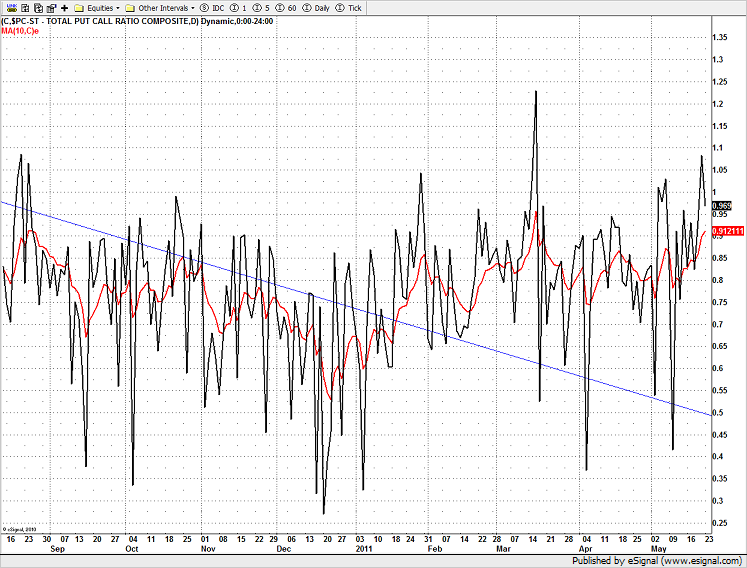
The put/call ratio has retreated from a mild overbought reading Friday.
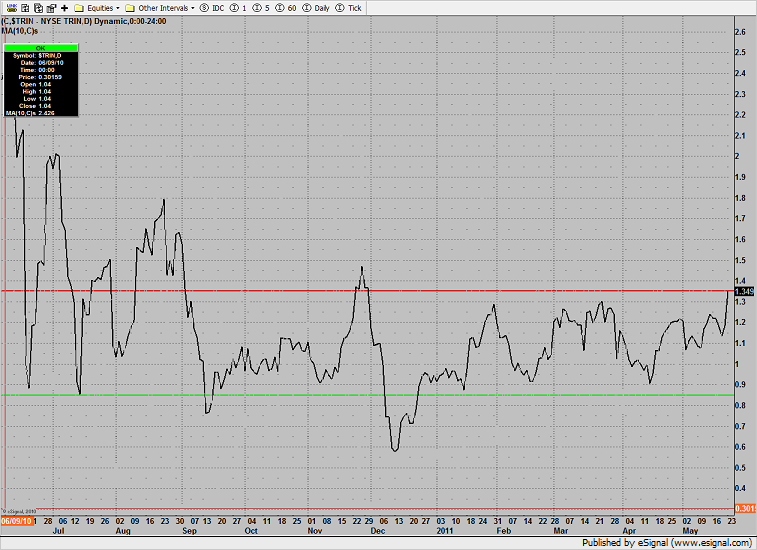
The 10-day Trin closed right at the 1.35 oversold threshold, implying that there is now oversold energy in the market for the first time since 2010.
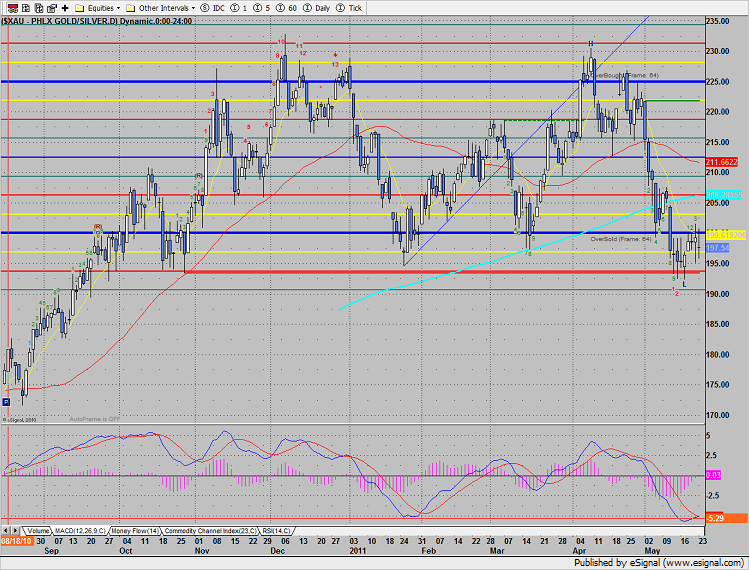
The XAU was the “least worst” sector on the day only down 0.74% but below all three major moving averages. Note that the MACD is close to a positive turn.
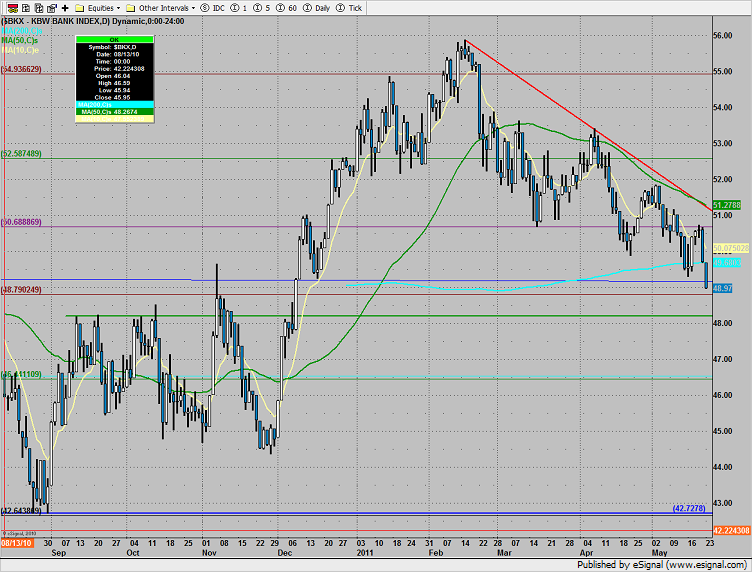
The BKX lost the 200dma and expanded the range lower, making a new low close for 2011.
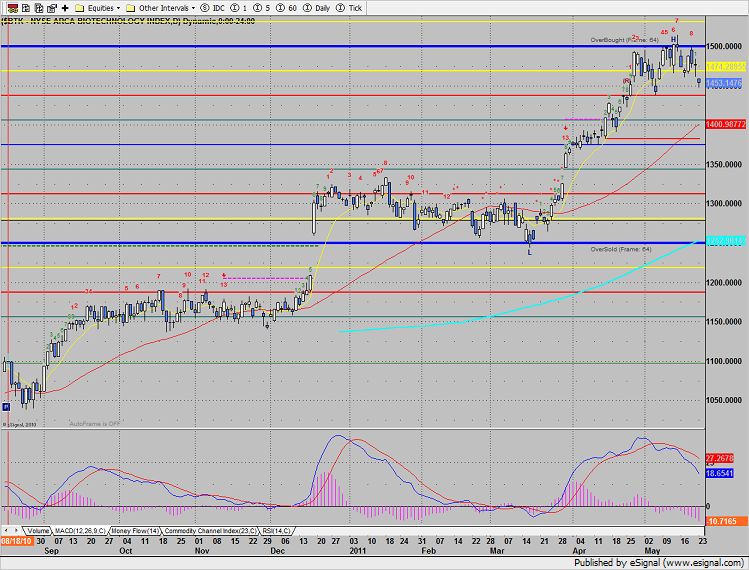
The BTK is close to the low of the recent range and the MACD is leaking.
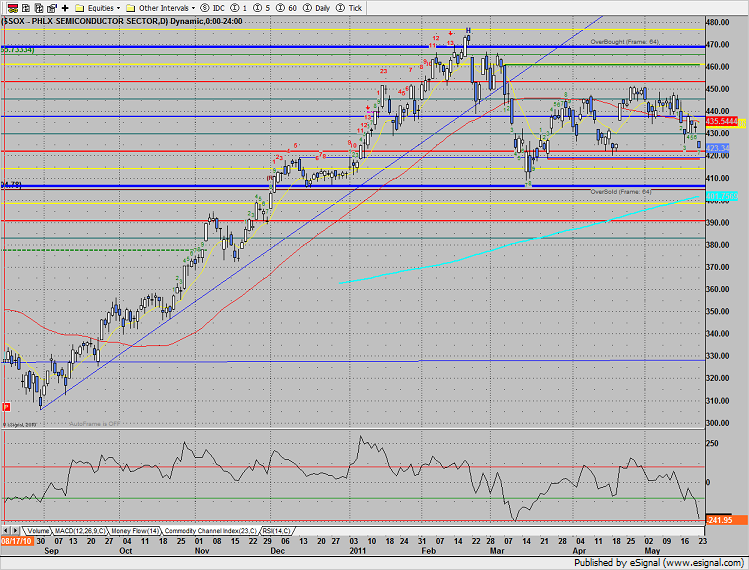
The SOX has fallen all the way back to the DTL breakout. Nothing positive happening here as the current Seeker count is only 7 days down. Note that the CCI is solidly oversold.
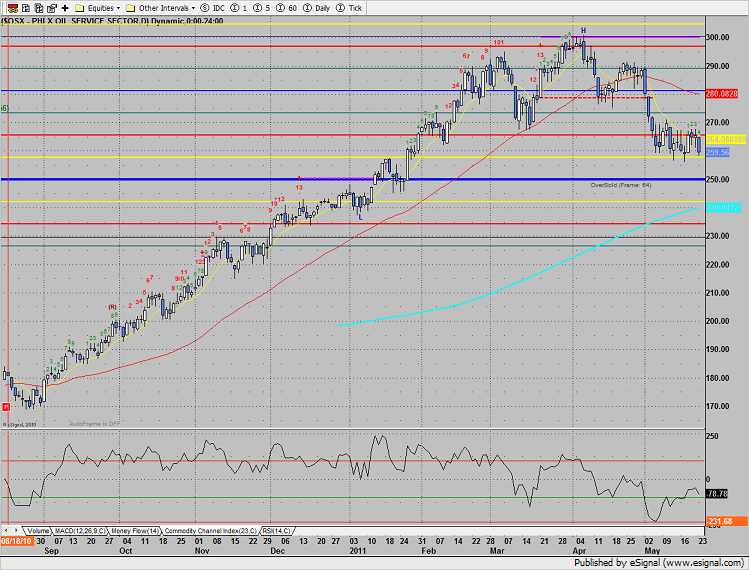
The OSX retreated to the low of the recent range and was the last laggard in performance. 256 is key support, especially on a closing basis.
Oil:

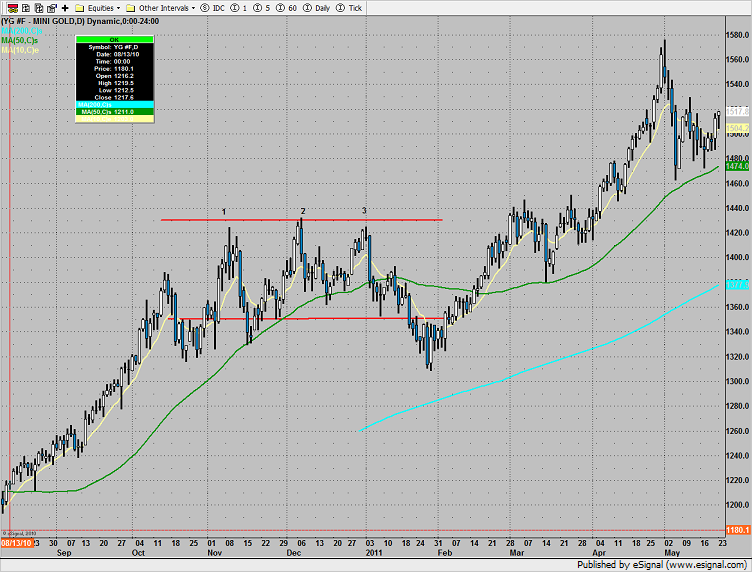
Gold:
Tradesight Market Preview for 5/24/11
May 23, 2011
|In Tradesight