This last week, there has been a lot of attention given to the stock price of AAPL, which was largely running up ahead of the launch event for the iPad 3 (or iPad Next or The New iPad, depending on what you want to call it).
One of the things that we teach as traders is that you can marry a product that a company makes, but you should never marry the stock of that company. They are not one and the same.
Conventional wisdom would have you believe that AAPL would run up all the way to the announcement, and then possibly sell-off. The problem is that this run over the last two months was parabolic and extreme. We’re talking about a stock that went from $410 to $550 in 60 days in anticipation. So I would suggest that there is more to the “top” than just the event.
In this case, we had what I consider to be a near 100% sell signal on AAPL…five days ago. And we called it on Twitter and elsewhere. And we bought puts and shorted. And over the next week, we had more short trades than long trades each day on AAPL (there was one day for a long, which I will explain below).
AAPL remains one of the most technical stocks out there. It behaves by certain technical rules…not by news.
Let’s start with a look at the beginning of the run in AAPL two months ago. We have a tool that uses a specific lookback methodology to count momentum, called the Tradesight Seeker. I’ll skip the details, but there are two phases to the count. First, we have a 9 bar green number count that must be consecutive. Once one of those reaches the ninth bar, then we have a separate 13 red count that uses a different counting method that does not have to be consecutive. In general, a 13 is a sell signal (in this case, works as a buy in the other direction too). We find that this is about 75-80% accurate when these signals are generated, but I’ll show you in a minute where they become more valid.
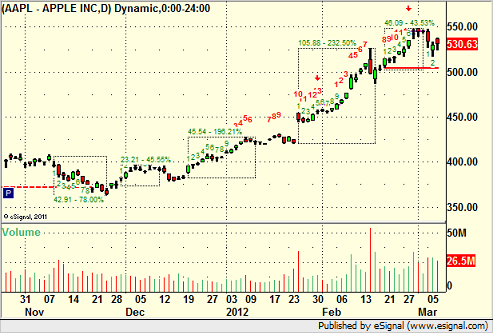
So here’s the daily chart in AAPL where the run started in late December/early January:
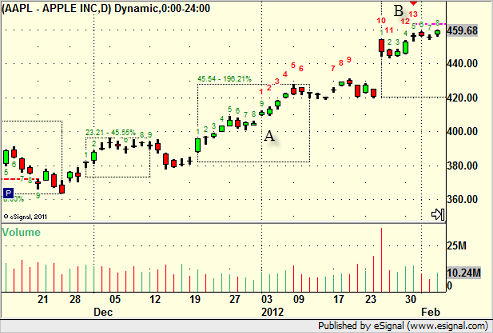
You can see that the 9-bar setup count completed above point A with the green 9. This led to a new count, which is the red 13 eventual sell signal at the beginning of February. In this particular case, AAPL flattened out a bit after that signal for a couple of days.
You can see a dashed line above that level. That is the “risk line.” If you close above that, you cover your short.
Remember that we see this tool work about 75-80% of the time, which isn’t 100%, of course. That’s why you have a risk line, to tell you where to get out.
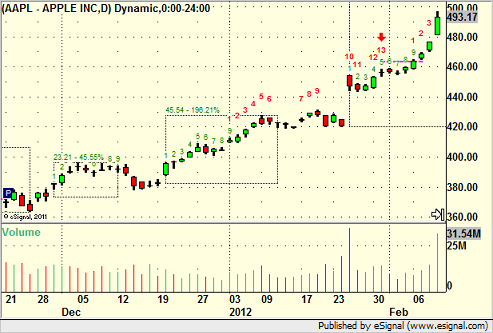
But, what is unique about this AAPL chart is that immediately following that point, it broke above the risk line and created another 9 bar setup:
It then proceeded to generate another 13 bar sell signal after the close on 2/28/12, which was a Tuesday. Here’s a look at the next move leading up to that point, with the 9-bar setup at A and the sell signal at B:
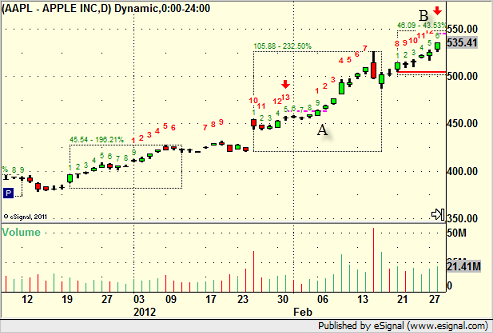
What’s important here, however, is to remember that this tool measures energy in a stock. Failing once just means that it falls into the category of the 25-30% that are losers. To immediately then proceed through an entire count of both the 9-bar setup and 13-bar Seeker sell…I don’t know that I’ve ever seen that signal fail. At this point, the stock has clearly made a huge move to throw that second signal. The word “exhaustion” doesn’t begin to cover it.
Here is where it gets interesting in learning about the market and how it behaves from a technical perspective.
From that 13 sell signal on the daily chart on 2/28/12, the risk level is $545.06. Now, once the sell signal is in place, the easy thing to do is short any gaps up. Gaps tend to fill anyway, but with a major sell signal in play, they become higher probability.
Here’s the next two days intraday on a 5-minute chart of AAPL:
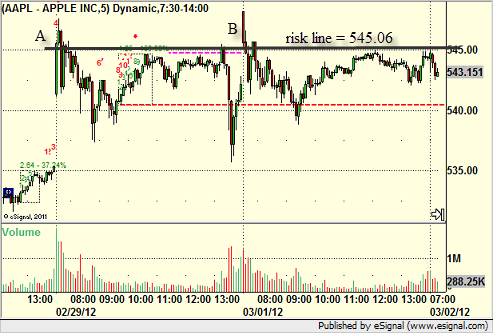
You can see the gap up that surged over the risk level “intraday.” That was a shorting opportunity for us, our first entry in the mix. This led to an abrupt 10 point roll in AAPL. More importantly, look how the $545.06 risk line that I’ve drawn played out against the price action for the next two days. Another attempt to break it late in the day led to another sharp sell-off. Then the next morning, we were given another gift of a gap over the risk level, another shorting opportunity. Keep in mind, this is now Friday, still a couple of days ahead of the iPad 3 launch meeting on the following Wednesday. At the time, I kept hearing all of the chants of $600 on AAPL for the announcement from the trading community. Meanwhile, while they held, we had racked up 25 points of gains on the short side.
What happened next? In the above chart, you can see that the stock opened up the next day right around 545 again and headed down in the early minutes. It ended up selling of Monday down to the $530 level. Then here are Tuesday and Wednesday (the day of the iPad 3 rollout):
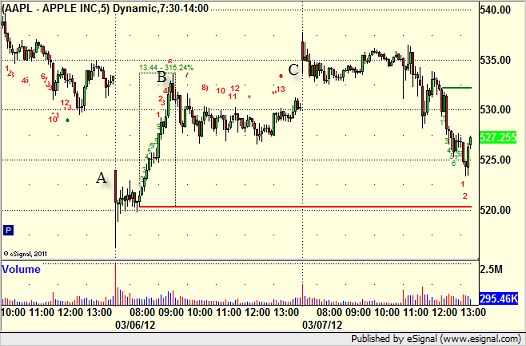
Note that we aren’t particular about our direction. We may have a general short bias currently on AAPL, but we’ve traded it plenty on the long side as well. On Tuesday, you gapped down to A on the above chart, and note that even in a sell-off environment, AAPL still does the technical thing and rallied up to fill that gap at B (which was the high of the day, and another shorting opportunity after that long side move).
And then another gift…a gap up Wednesday morning, the day of the rollout, which can’t possibly beat the hype. Another shorting opportunity.
In the end, here’s the final look on the daily with today’s close:
The top was predicted by the second 13 bar sell signal in a row, something that rarely happens, but you have to be aware of it when it does because the opportunity to make money is so great, no matter what product is launching.
The Ultimate AAPL Short Signal
March 7, 2012
|In Tradesight